Basemaps#
Here we will show the three options we have for basemaps. These can either be created as backgrounds for plotting your gridded / point data on top of, or used by themselves.
Either set the parameters simple_basemap, imagery_basemap,or modis_basemap to True in either function maps.plot_grd() or maps.basemap().
Alternatives, use the equivalent functions on existing figures: maps.add_simple_basemap(), maps.add_imagery(), or maps.add_modis().
Import the modules
[1]:
%load_ext autoreload
%autoreload 2

import os

from polartoolkit import fetch, maps, regions
[2]:
# set default to southern hemisphere for this notebook
os.environ["POLARTOOLKIT_HEMISPHERE"] = "south"
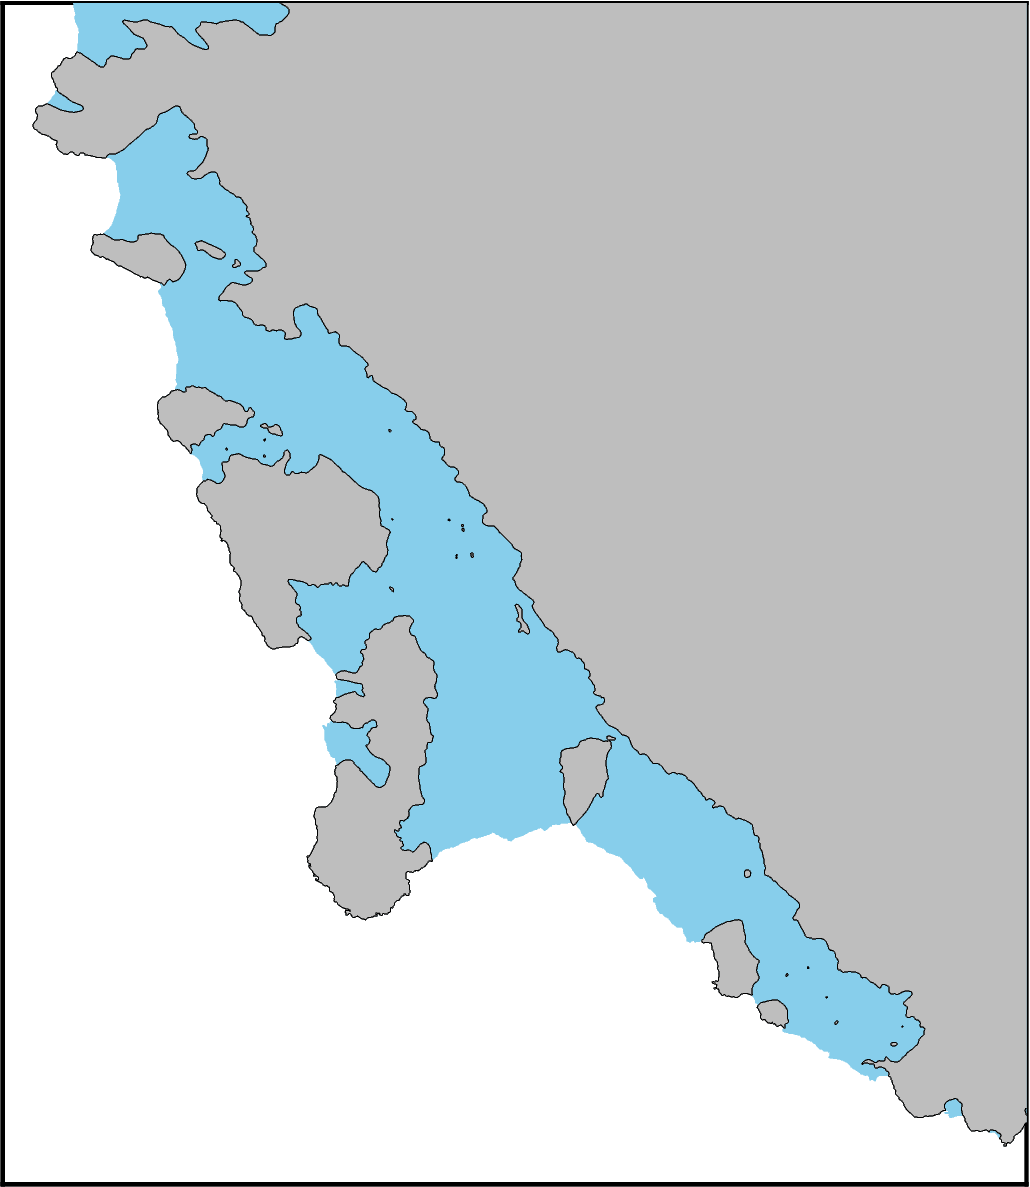
Basemap of grounded vs floating ice#
[3]:
# by default uses Depoorter et al. 2013 shapefiles
fig = maps.basemap(
    simple_basemap=True,
    region=regions.getz_ice_shelf,
)

fig.show(dpi=200)
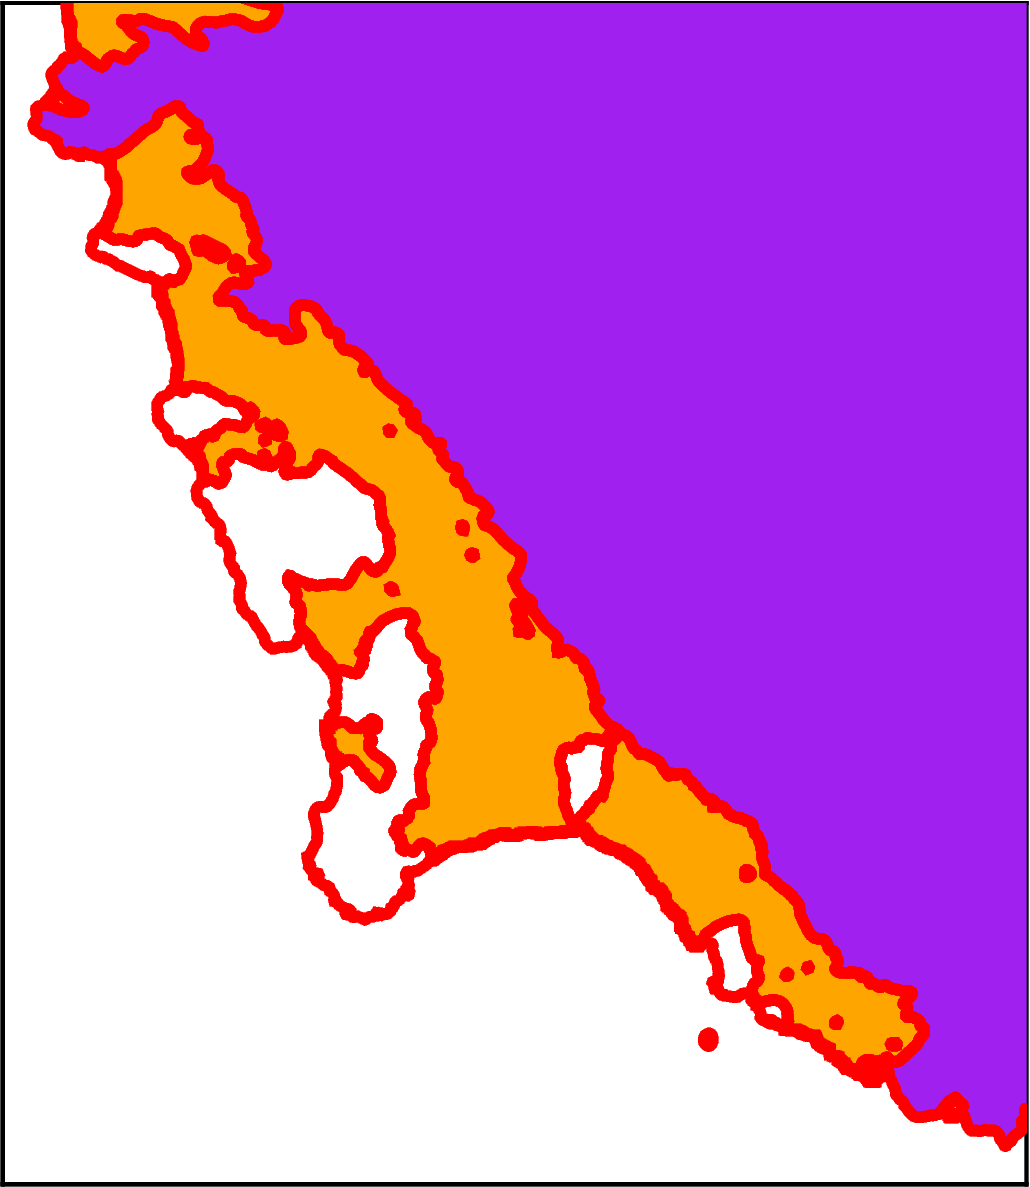
[4]:
# change the version of the simple basemap to use MEaSUREs v2 shapefiles
# specify different colors
fig = maps.basemap(
    simple_basemap=True,
    simple_basemap_version="depoorter-2013",
    simple_basemap_grounded_color="purple",
    simple_basemap_floating_color="orange",
    simple_basemap_pen="4p,red",
    region=regions.getz_ice_shelf,
)

fig.show(dpi=200)
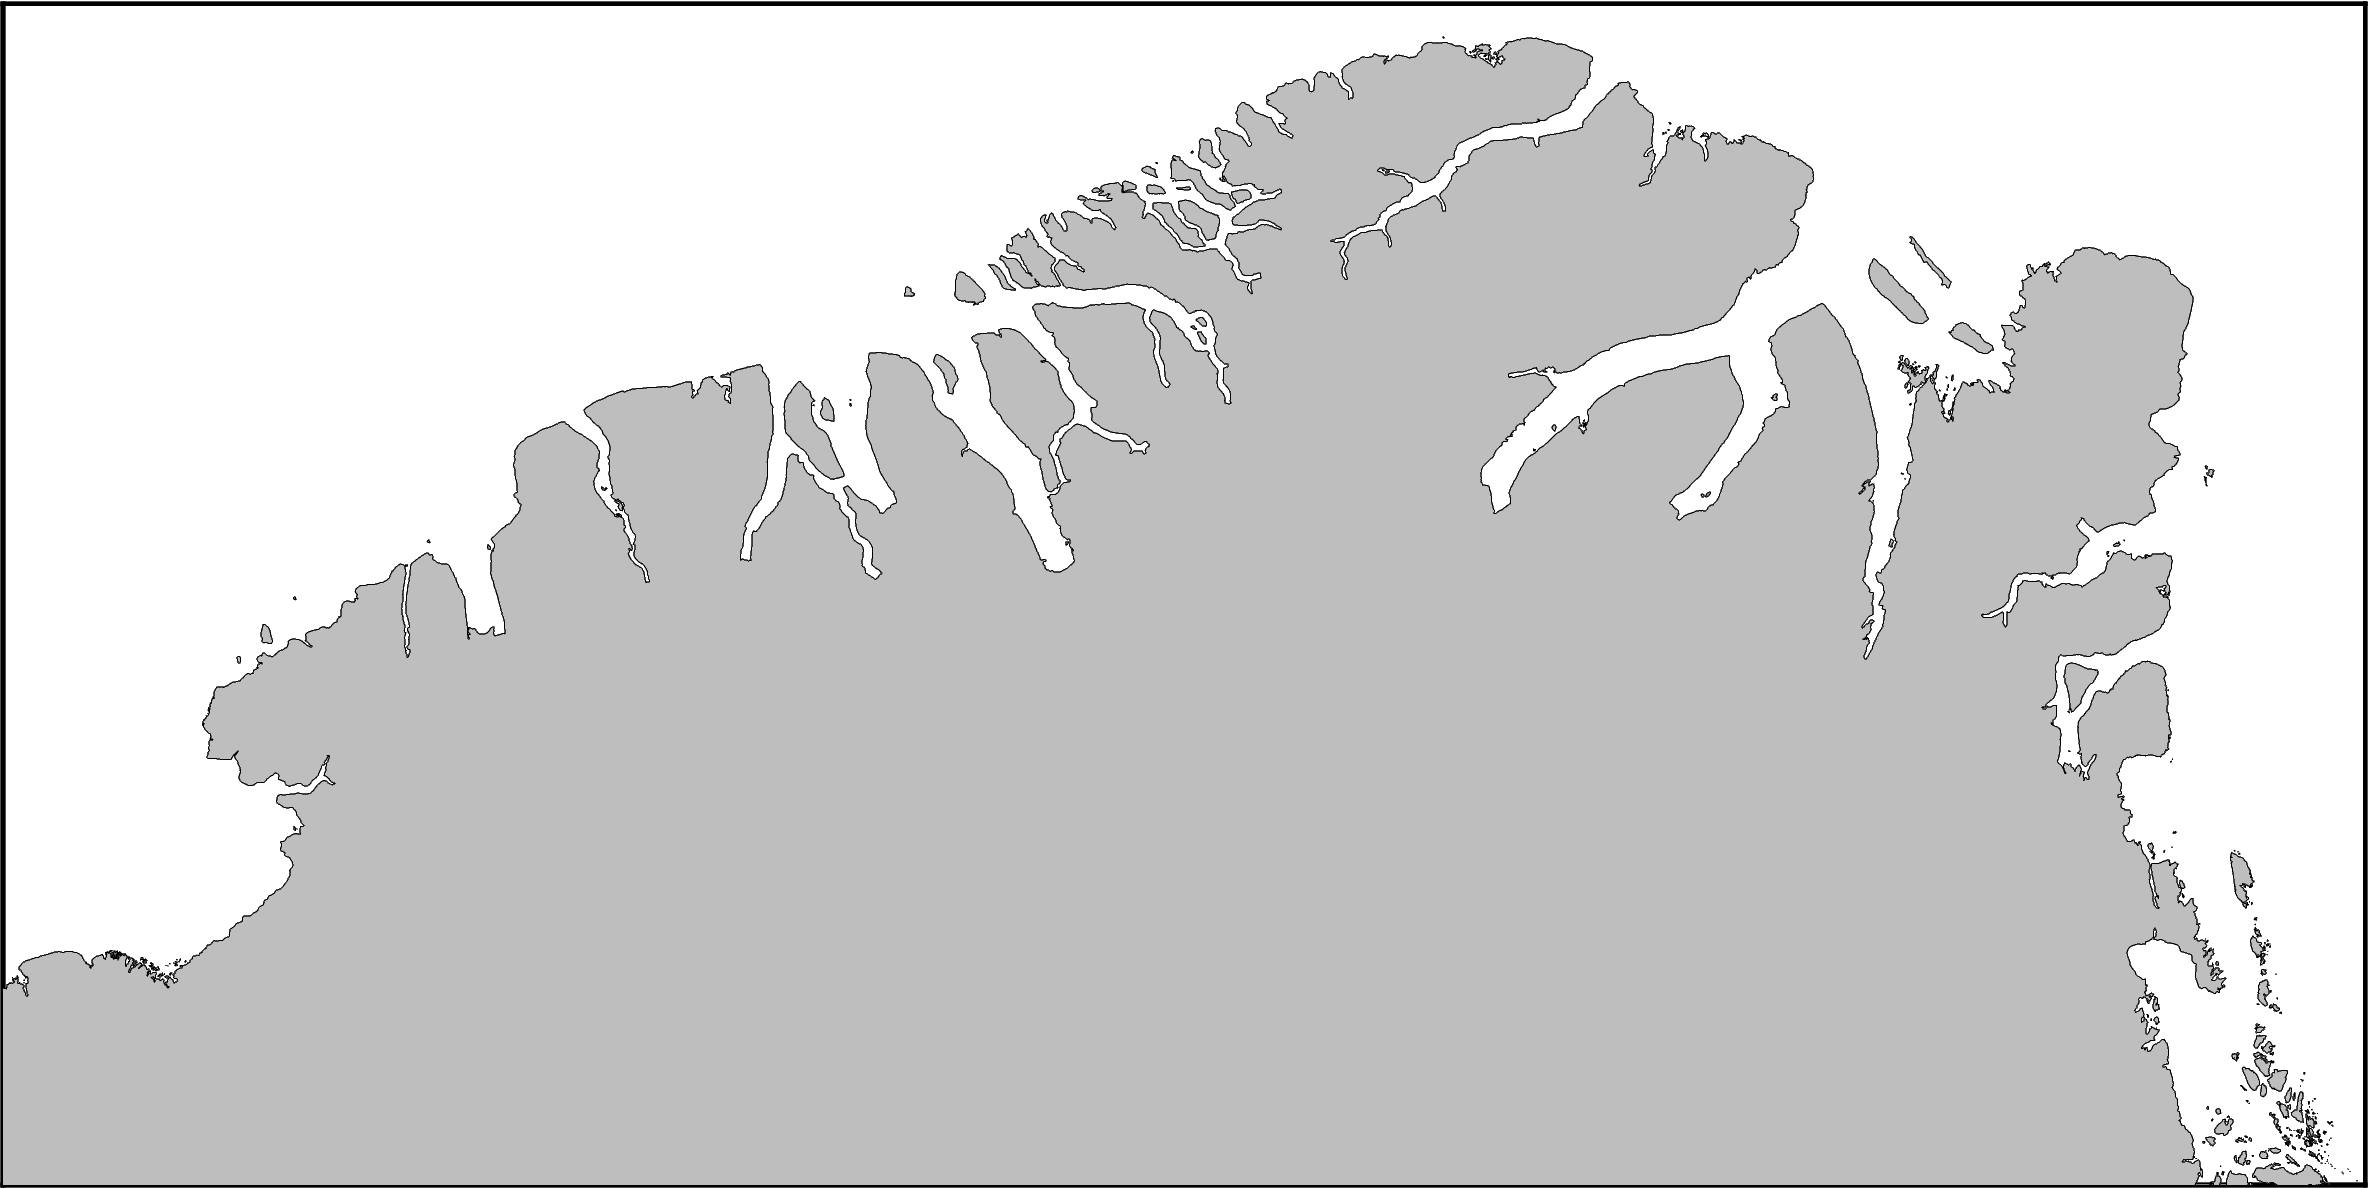
[5]:
# equivalent for the northern hemisphere only shows grounded ice
fig = maps.basemap(
    simple_basemap=True,
    hemisphere="north",
    region=regions.north_greenland,
)

fig.show(dpi=200)
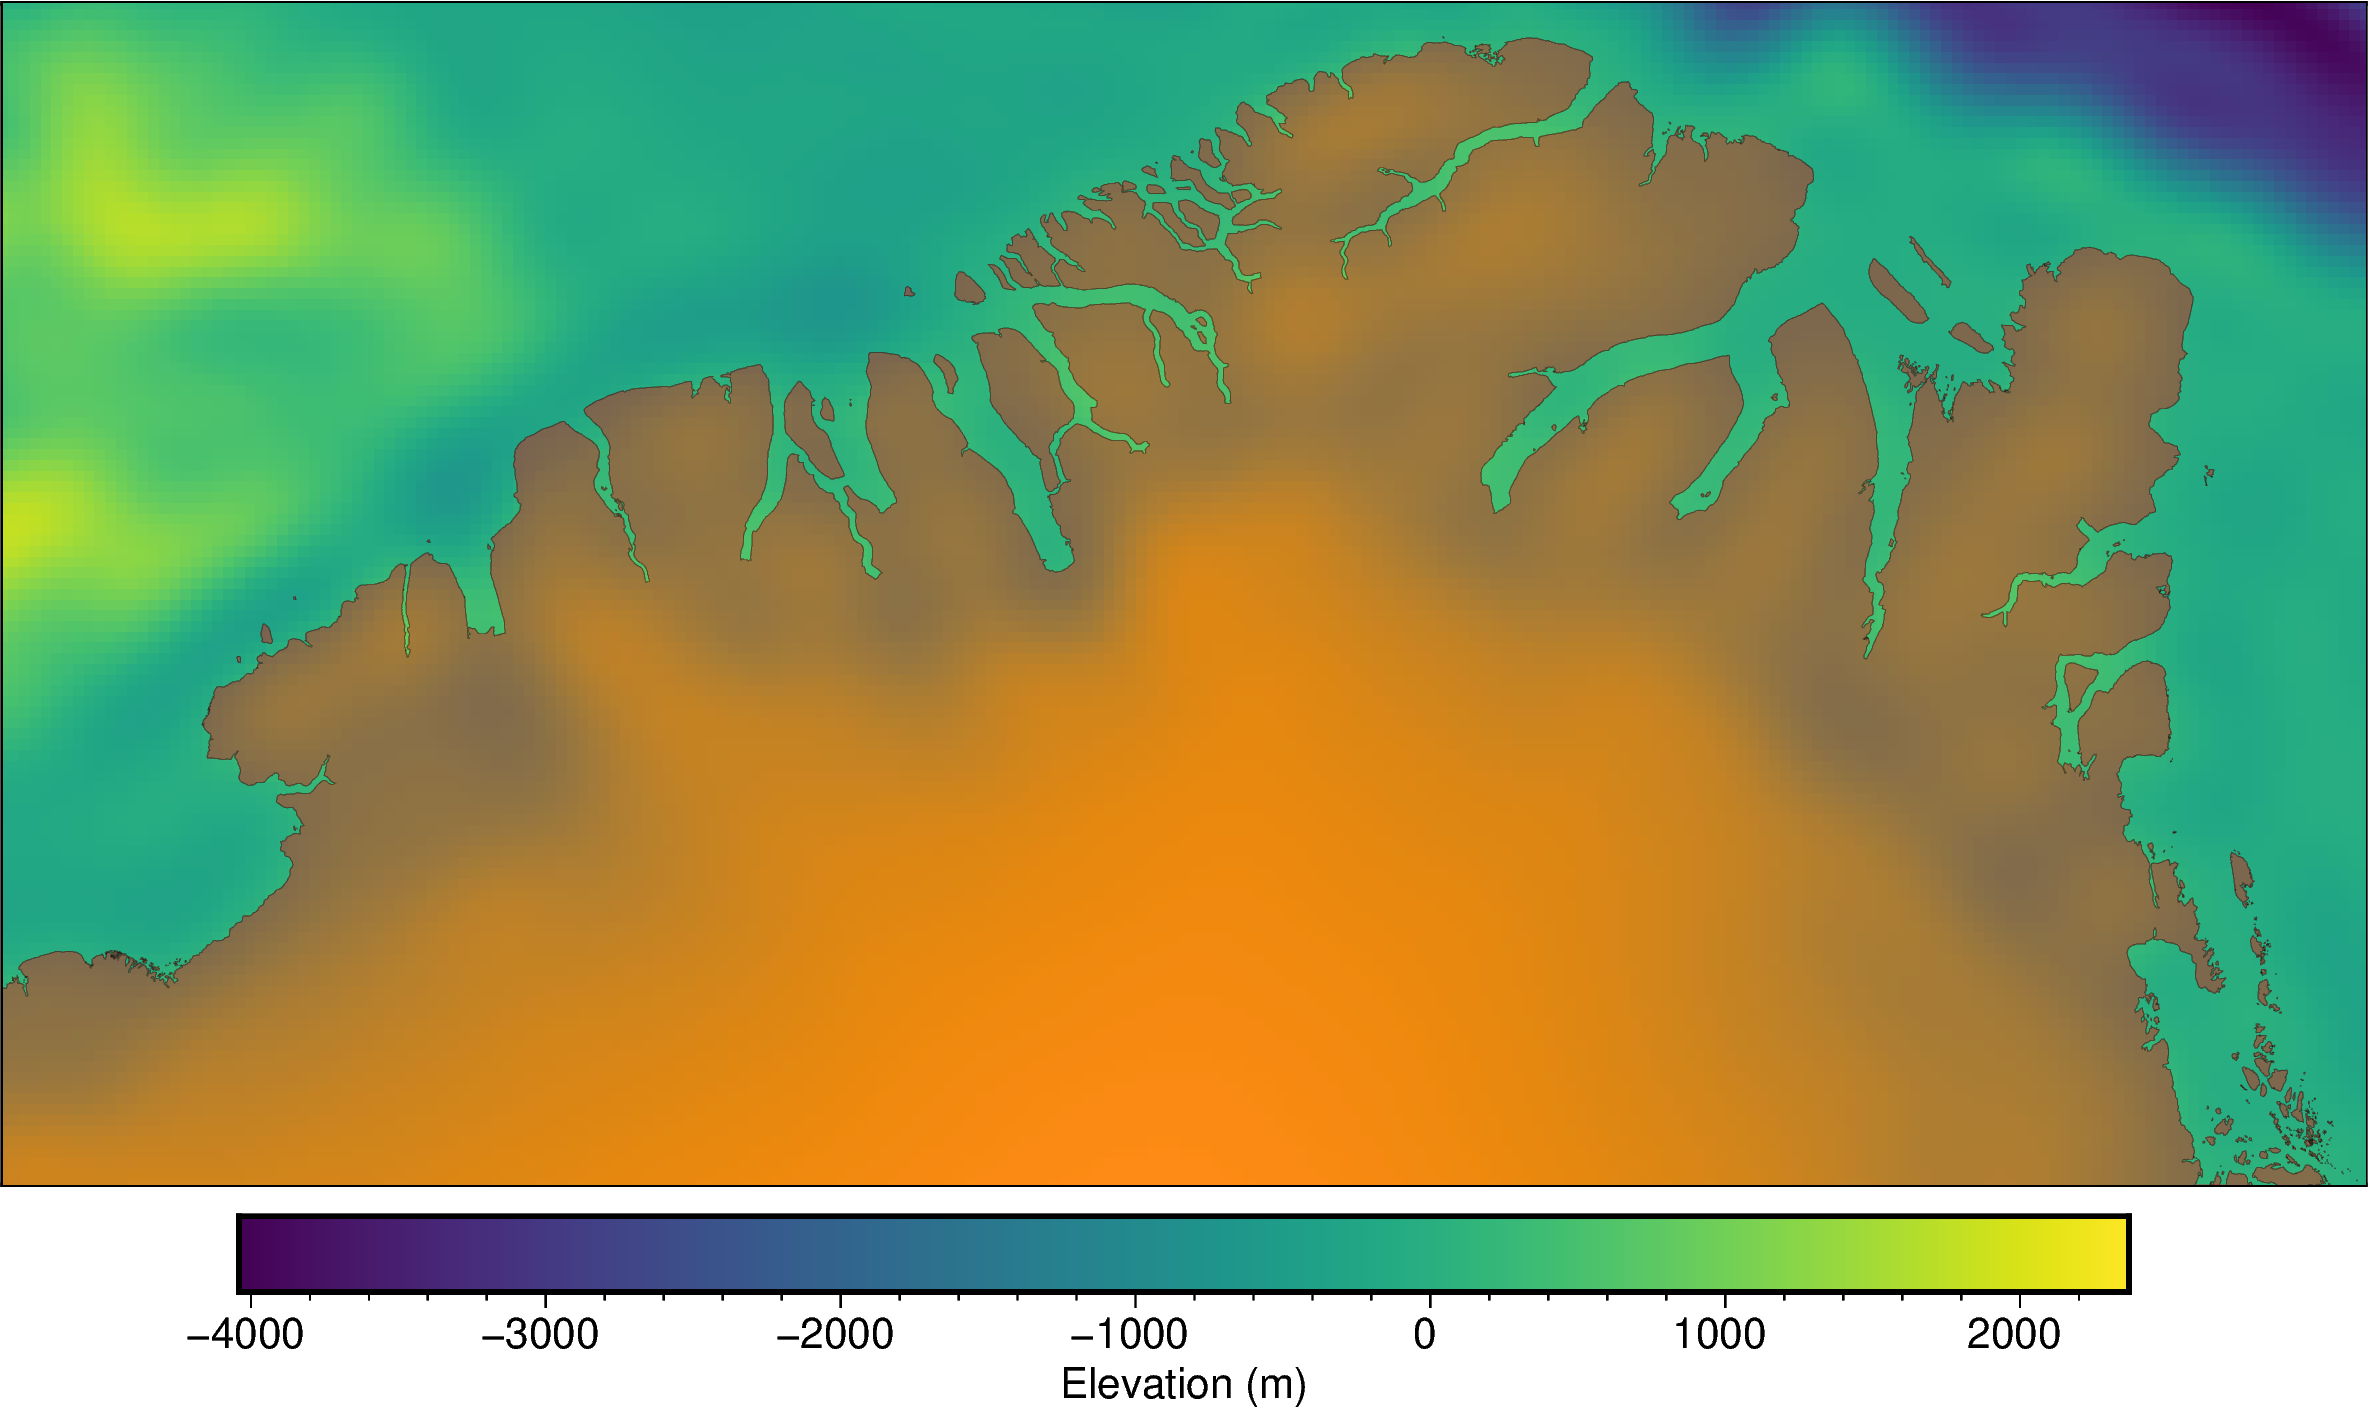
Add to existing figure#
This will cover any portions of the existing figure for grounded or floating ice. You can supply options kwarg transparency to make the simple basemap transparent.
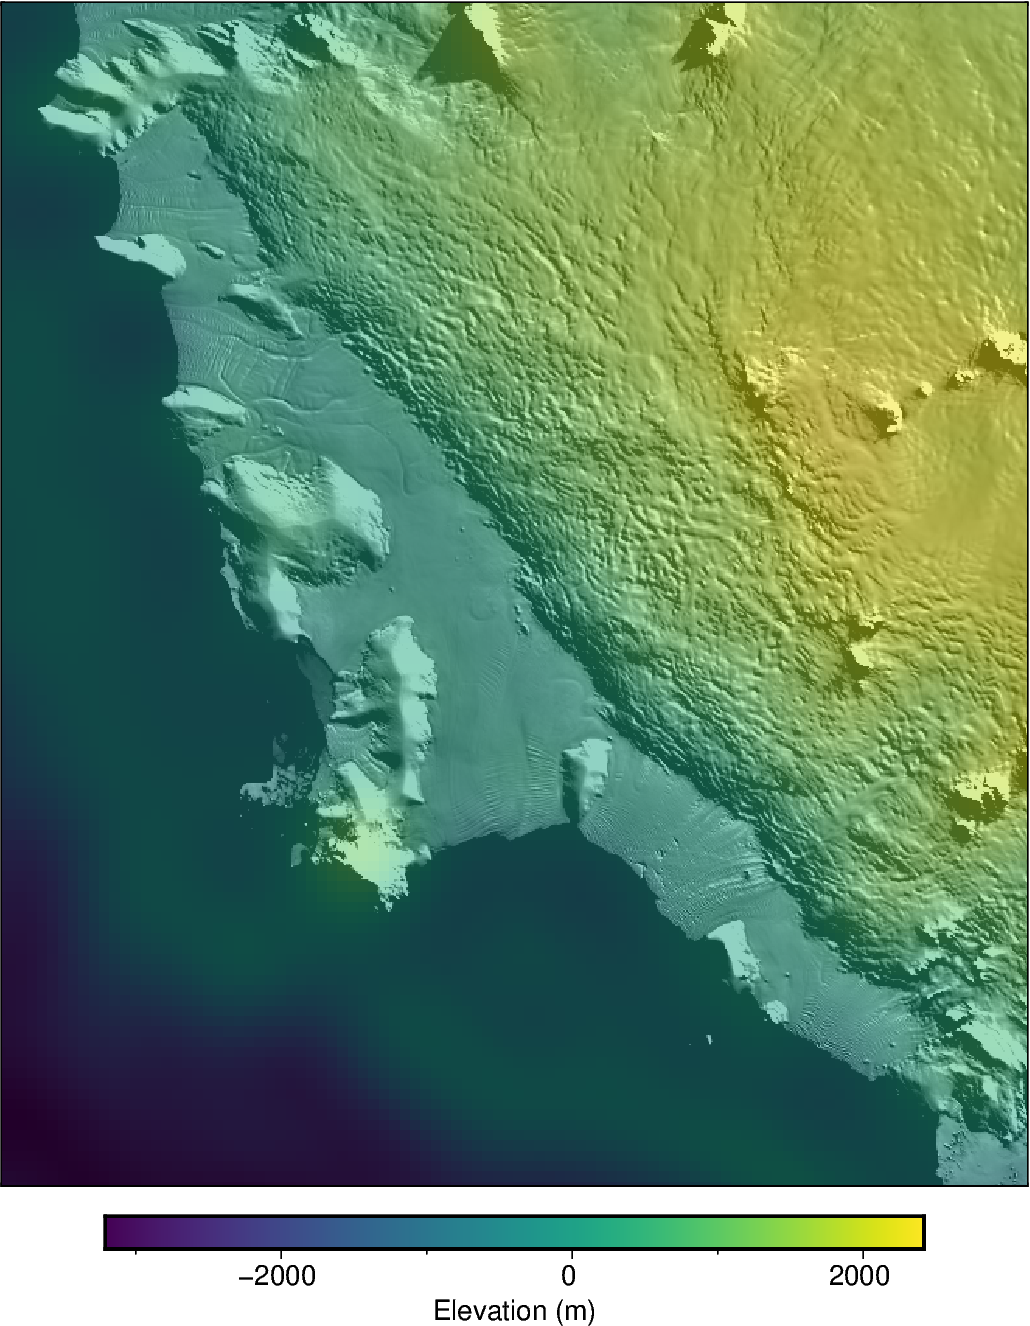
[6]:
# create figure
fig = maps.plot_grd(
    fetch.etopo(hemisphere="north"),
    region=regions.north_greenland,
    cbar_label="Elevation (m)",
    hemisphere="north",
)

# add the basemap
fig.add_simple_basemap(
    grounded_color="red",
    transparency=60,
)
fig.show(dpi=200)
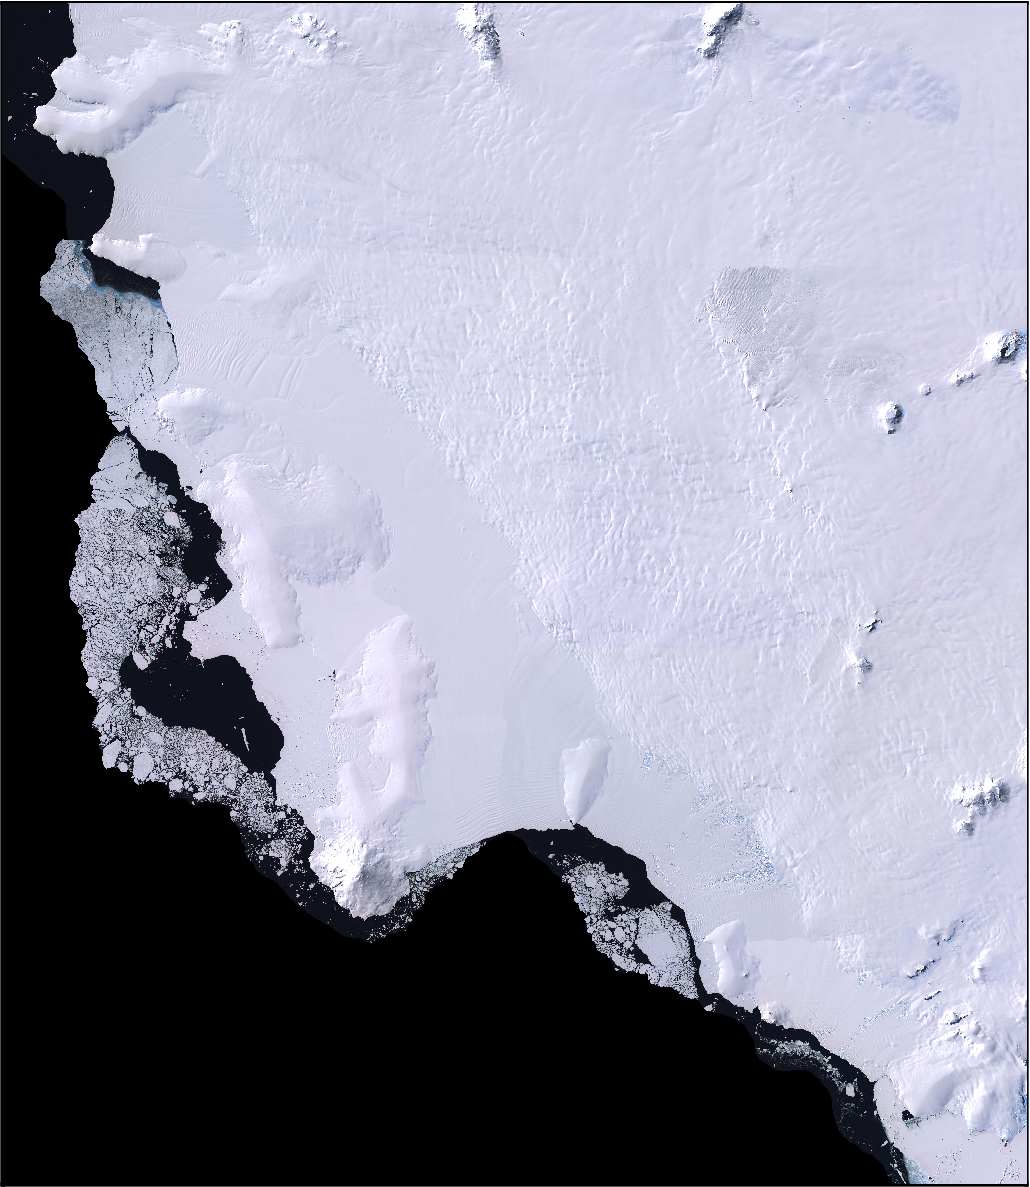
Satellite imagery basemap#
[7]:
fig = maps.basemap(
    imagery_basemap=True,
    region=regions.getz_ice_shelf,
)

fig.show(dpi=200)
grdimage [WARNING]: (w - x_min) must equal (NX + eps) * x_inc), where NX is an integer and |eps| <= 0.0001.
grdimage [WARNING]: w reset from -1624000 to -1624229.29918
grdimage [WARNING]: (e - x_min) must equal (NX + eps) * x_inc), where NX is an integer and |eps| <= 0.0001.
grdimage [WARNING]: e reset from -1130000 to -1129807.66209
grdimage [WARNING]: (s - y_min) must equal (NY + eps) * y_inc), where NY is an integer and |eps| <= 0.0001.
grdimage [WARNING]: s reset from -1234000 to -1234065.03774
grdimage [WARNING]: (n - y_min) must equal (NY + eps) * y_inc), where NY is an integer and |eps| <= 0.0001.
grdimage [WARNING]: n reset from -664000 to -663825.03652
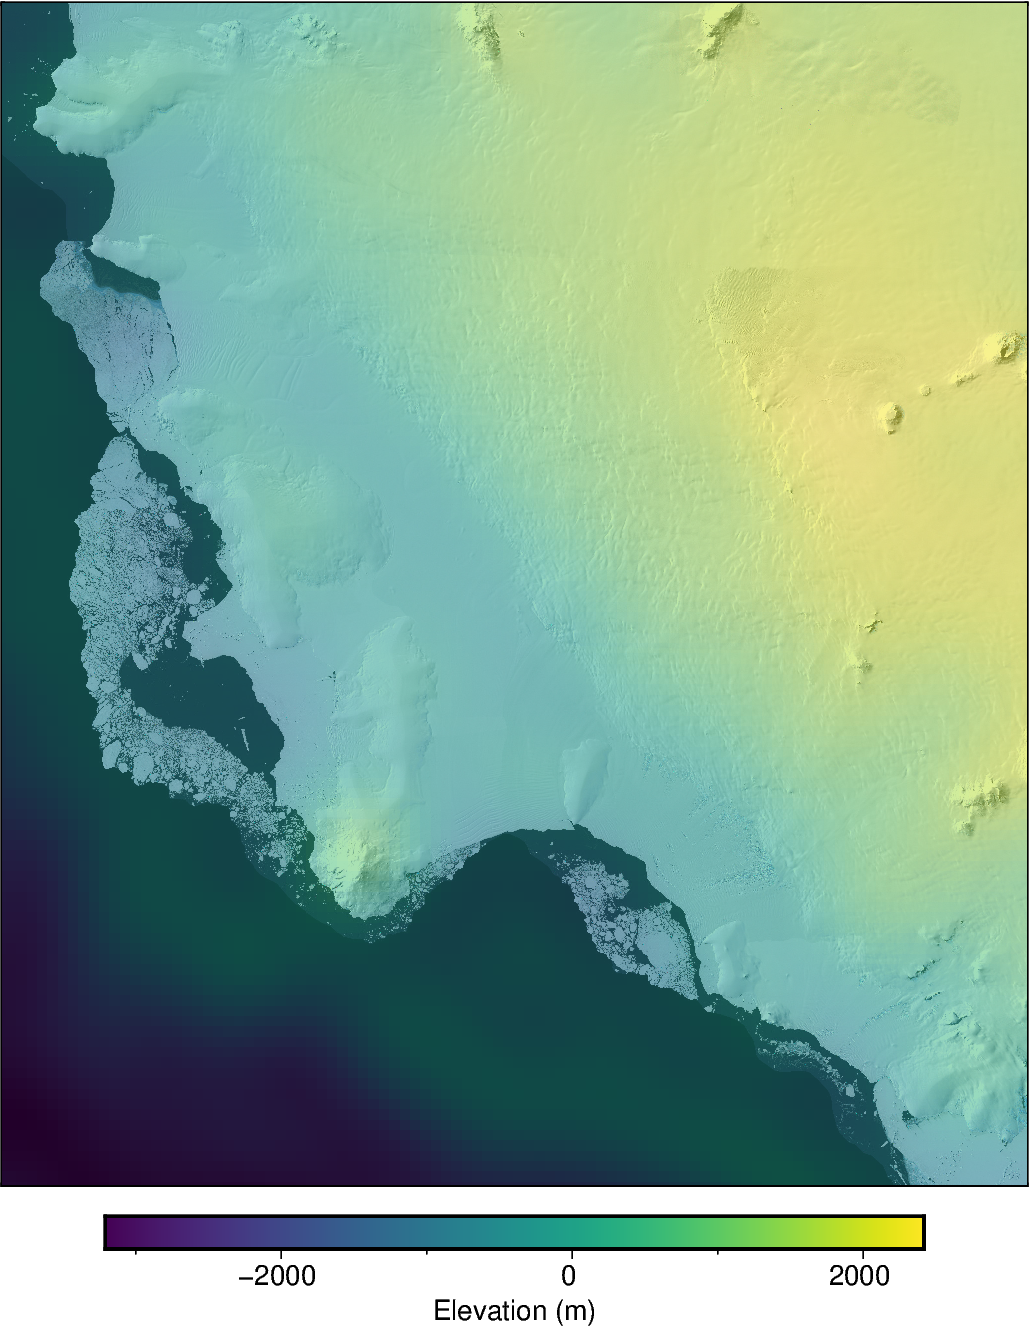
Add to existing figure#
[8]:
# create figure
fig = maps.plot_grd(
    fetch.etopo(),
    region=regions.getz_ice_shelf,
    cbar_label="Elevation (m)",
)

# add the LIMA imagery, but make it semi-transparent to be able to see grid values
# behind
fig.add_imagery(
    transparency=50,
)
fig.show(dpi=200)
grdimage [WARNING]: (w - x_min) must equal (NX + eps) * x_inc), where NX is an integer and |eps| <= 0.0001.
grdimage [WARNING]: w reset from -1624000 to -1624229.29918
grdimage [WARNING]: (e - x_min) must equal (NX + eps) * x_inc), where NX is an integer and |eps| <= 0.0001.
grdimage [WARNING]: e reset from -1130000 to -1129807.66209
grdimage [WARNING]: (s - y_min) must equal (NY + eps) * y_inc), where NY is an integer and |eps| <= 0.0001.
grdimage [WARNING]: s reset from -1234000 to -1234065.03774
grdimage [WARNING]: (n - y_min) must equal (NY + eps) * y_inc), where NY is an integer and |eps| <= 0.0001.
grdimage [WARNING]: n reset from -664000 to -663825.03652
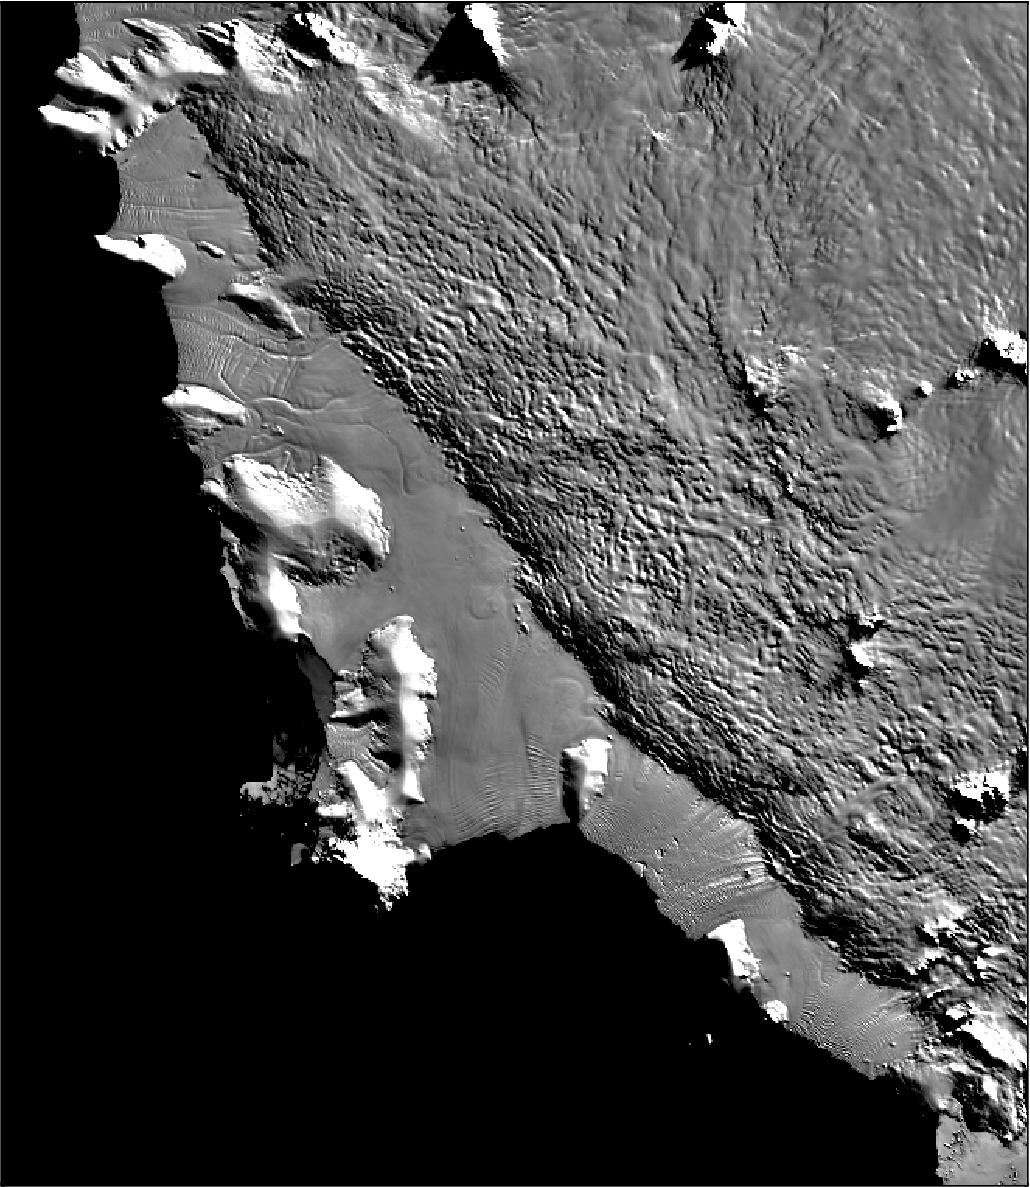
MODIS imagery basemap#
[9]:
# by default for Antarctica is 750 m MODIS resolution
fig = maps.basemap(
    modis_basemap=True,
    region=regions.getz_ice_shelf,
    # modis_version="125m", # uncomment this to use 125 m resolution MODIS imagery
)
fig.show(dpi=200)
/home/sungw937/miniforge3/envs/polartoolkit/lib/python3.12/site-packages/pygmt/clib/session.py:657: RuntimeWarning: The definition of geographic CRS EPSG:4326 got from GeoTIFF keys is not the same as the one from the EPSG registry, which may cause issues during reprojection operations. Set GTIFF_SRS_SOURCE configuration option to EPSG to use official parameters (overriding the ones from GeoTIFF keys), or to GEOKEYS to use custom values from GeoTIFF keys and drop the EPSG code.
  status = c_call_module(self.session_pointer, module.encode(), mode, argv)
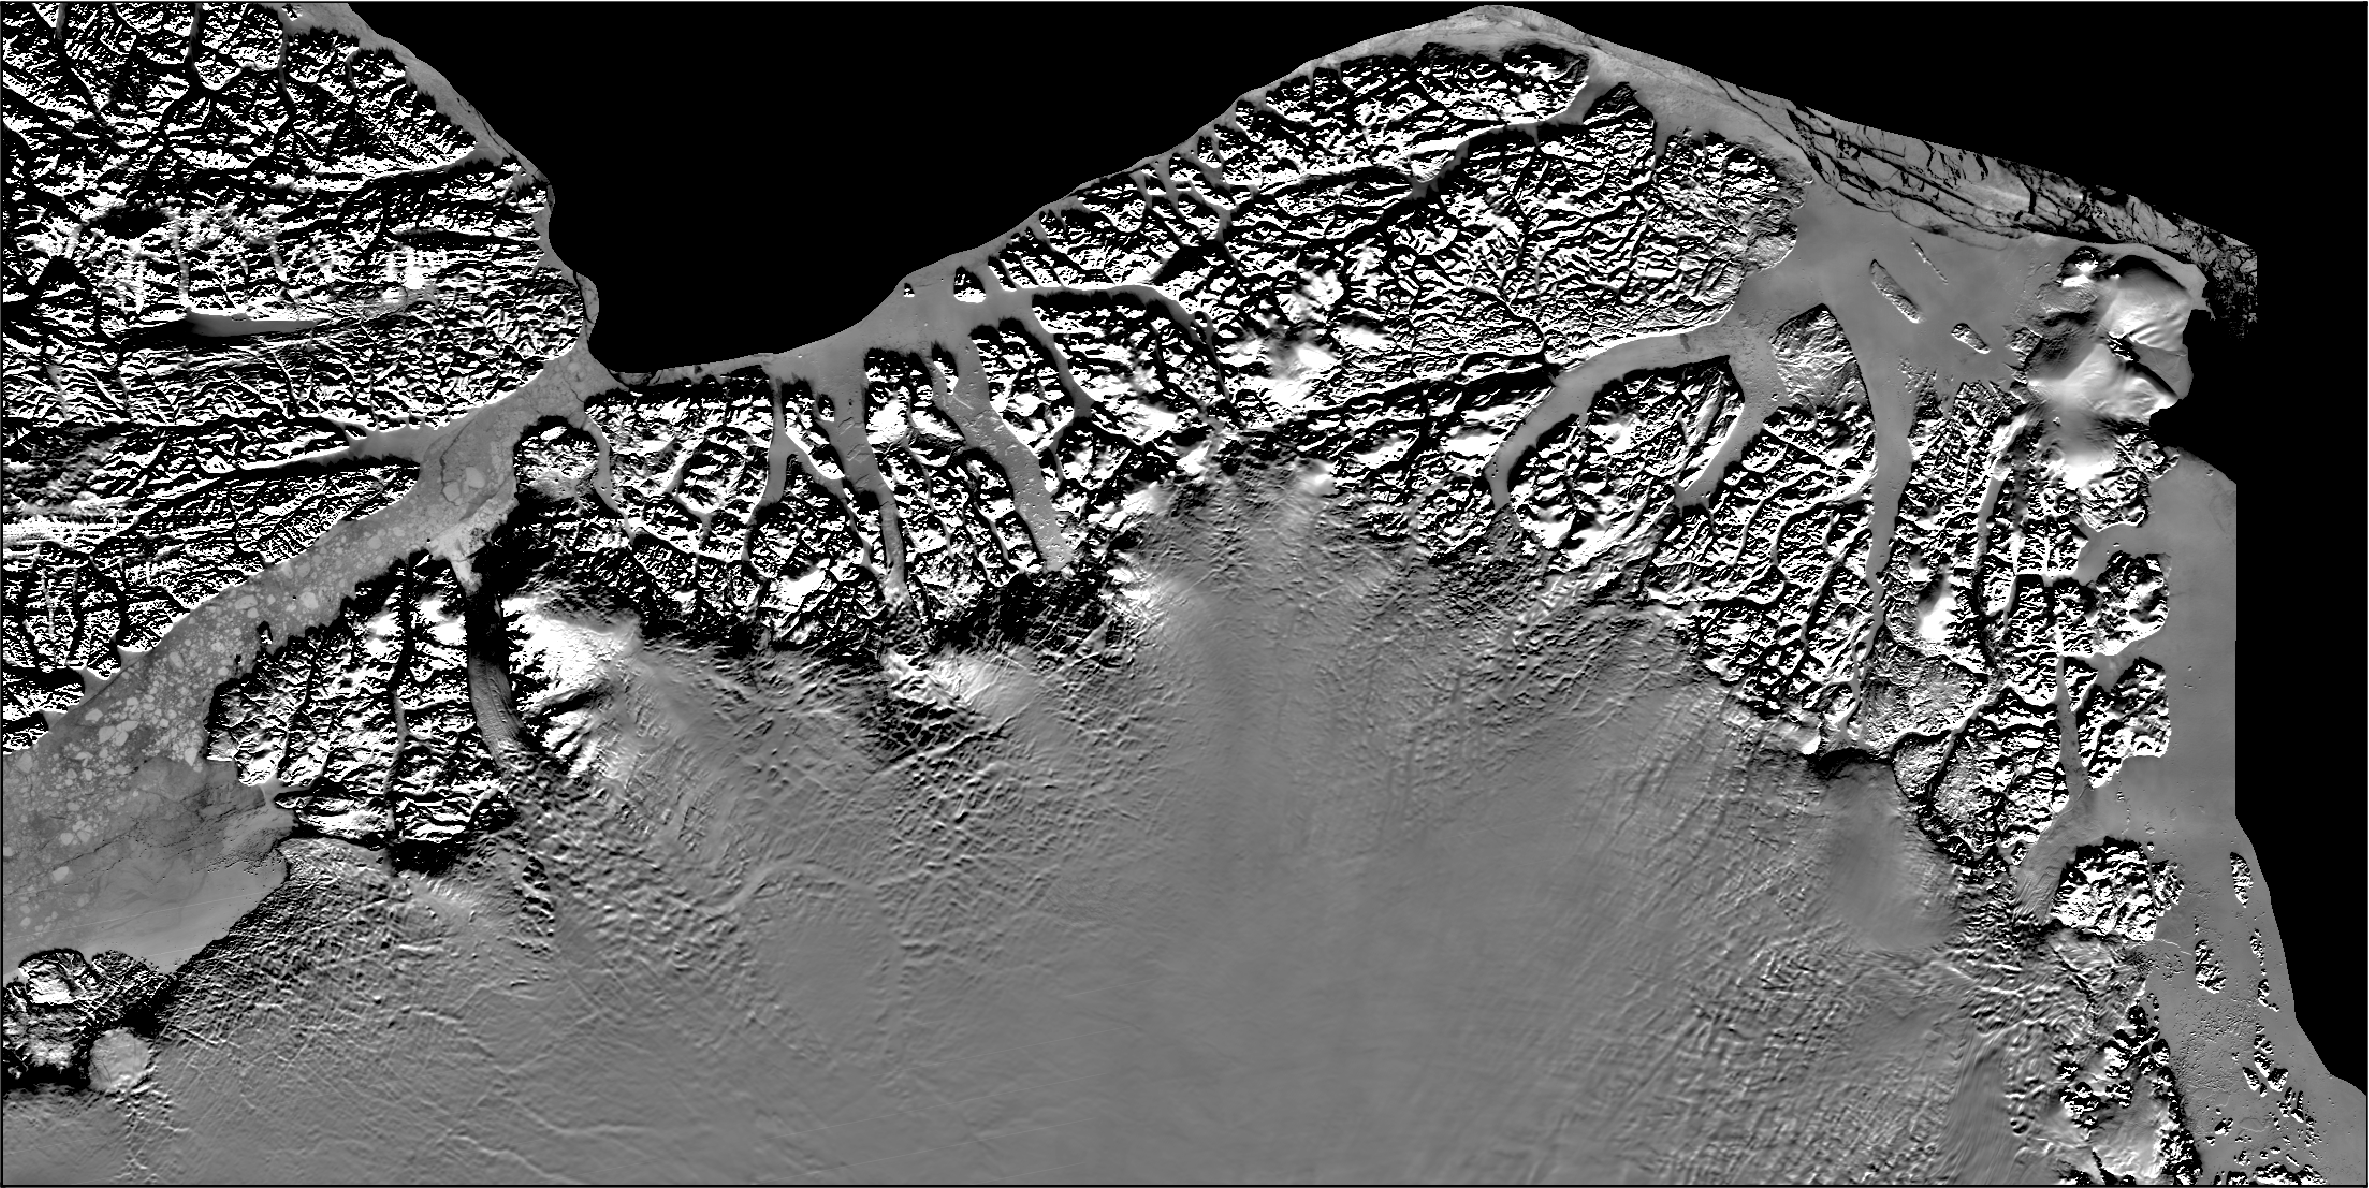
[10]:
# equivalent for the northern hemisphere, by default uses 500 m MODIS resolution
fig = maps.basemap(
    modis_basemap=True,
    hemisphere="north",
    region=regions.north_greenland,
)

fig.show(dpi=200)
Add to existing figure#
[11]:
# create figure
fig = maps.plot_grd(
    fetch.etopo(),
    region=regions.getz_ice_shelf,
    cbar_label="Elevation (m)",
)

# add the MODIS imagery, but make it semi-transparent to be able to see grid values
# behind
fig.add_modis(
    transparency=50,
)
fig.show(dpi=200)
/home/sungw937/miniforge3/envs/polartoolkit/lib/python3.12/site-packages/pygmt/clib/session.py:657: RuntimeWarning: The definition of geographic CRS EPSG:4326 got from GeoTIFF keys is not the same as the one from the EPSG registry, which may cause issues during reprojection operations. Set GTIFF_SRS_SOURCE configuration option to EPSG to use official parameters (overriding the ones from GeoTIFF keys), or to GEOKEYS to use custom values from GeoTIFF keys and drop the EPSG code.
  status = c_call_module(self.session_pointer, module.encode(), mode, argv)
[ ]: