3. Create a simple map#
Here we will showcase creating two very simple maps. All of the plotting functions in PolarToolkit use the python package PyGMT, which is a python wrapper on the widely-used GMT (Generic-Mapping-Tools).
Import the modules
[1]:
from polartoolkit import fetch, maps, regions
3.1. Map 1:#
Make a simple figure with a basemap showing grounding ice and floating ice. To see other types of basemaps we offer, see
[2]:
fig = maps.basemap(
    simple_basemap=True,
    region=regions.antarctica,
    hemisphere="south",
)
fig.show()

3.2. Map 2:#
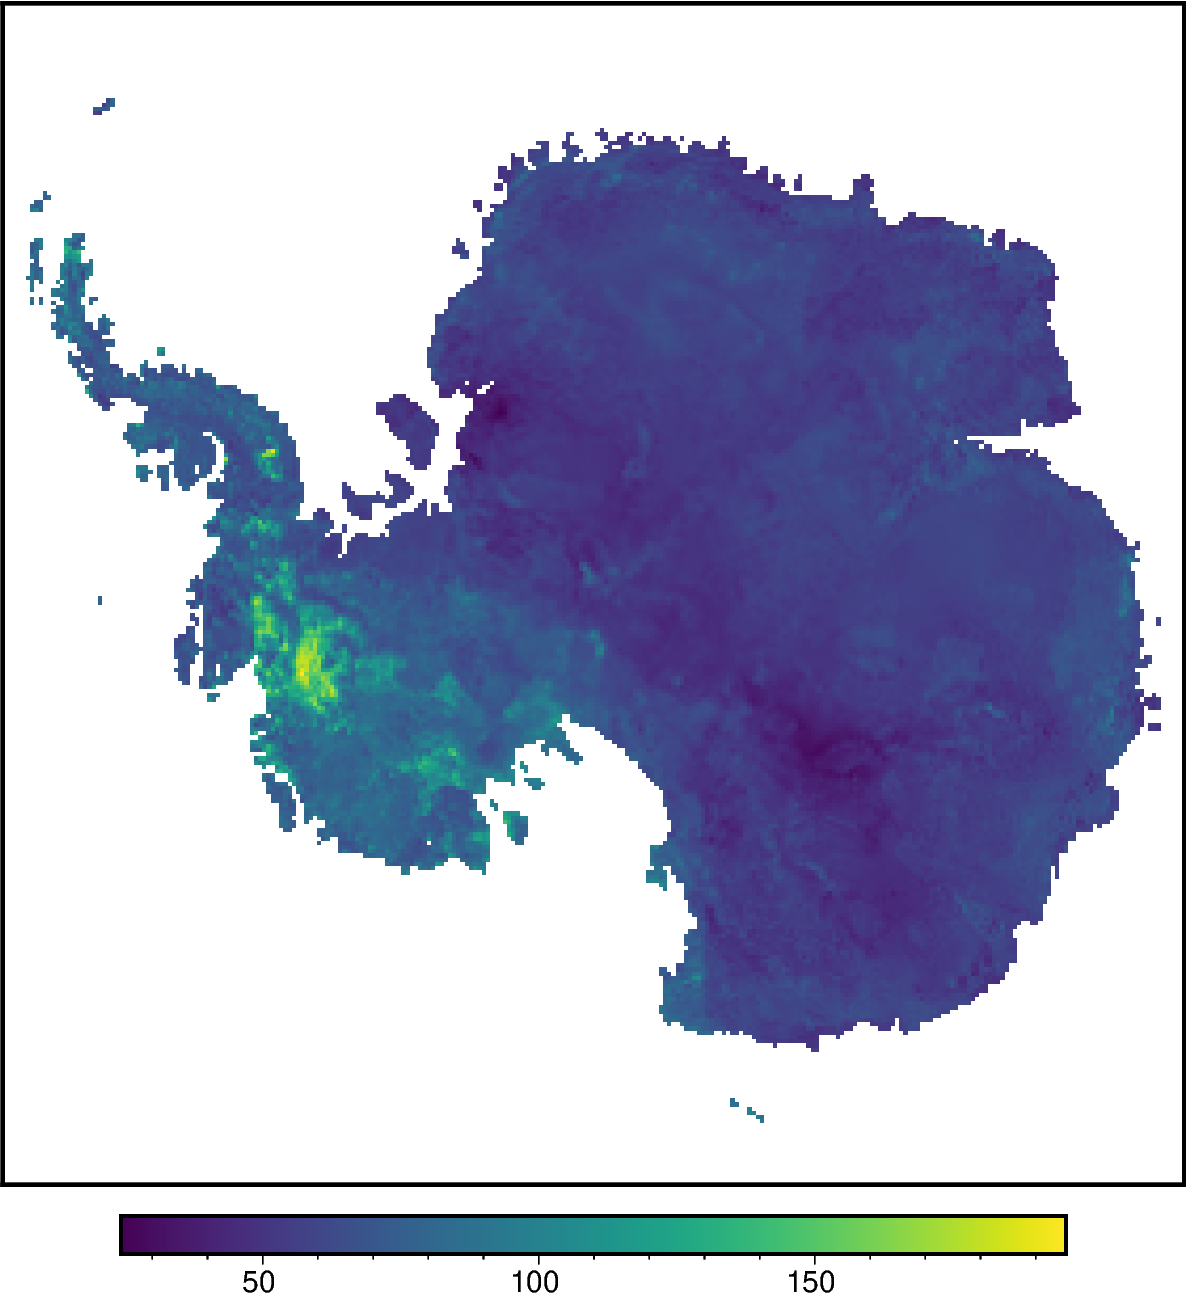
Use the PolarToolkit fetch module to download some Antarctic geothermal heat flux data and return the grid as an xarray.DataArray
[3]:
grid = fetch.ghf(
    version="aq1",
)
/home/sungw937/miniforge3/envs/polartoolkit/lib/python3.12/site-packages/pygmt/clib/session.py:1639: RuntimeWarning: Grid may have irregular spacing in the 'X' dimension, but GMT only supports regular spacing. Calculated regular spacing 20071.685546875 is assumed in the 'X' dimension.
  matrix, region, inc = dataarray_to_matrix(grid)
/home/sungw937/miniforge3/envs/polartoolkit/lib/python3.12/site-packages/pygmt/clib/session.py:1639: RuntimeWarning: Grid may have irregular spacing in the 'Y' dimension, but GMT only supports regular spacing. Calculated regular spacing 20071.685546875 is assumed in the 'Y' dimension.
  matrix, region, inc = dataarray_to_matrix(grid)
WARNING:polartoolkit:requested spacing (20000.0) is smaller than the original (20071.6845878).
Create a simple map with default settings
[4]:
fig = maps.plot_grd(grid, hemisphere="south")

fig.show(dpi=200)
The next tutorial will show a series of the embellishments you can add to the map.