Adding map features#
Here we will showcase a few ways to add various features to a map.
Import the modules
[1]:
%load_ext autoreload
%autoreload 2

import os

from polartoolkit import fetch, maps, regions
[2]:
# set default to southern hemisphere for this notebook
os.environ["POLARTOOLKIT_HEMISPHERE"] = "south"
[3]:
ice_thickness = fetch.bedmap2(
    layer="ice_thickness",
    region=regions.amery_ice_shelf,
)
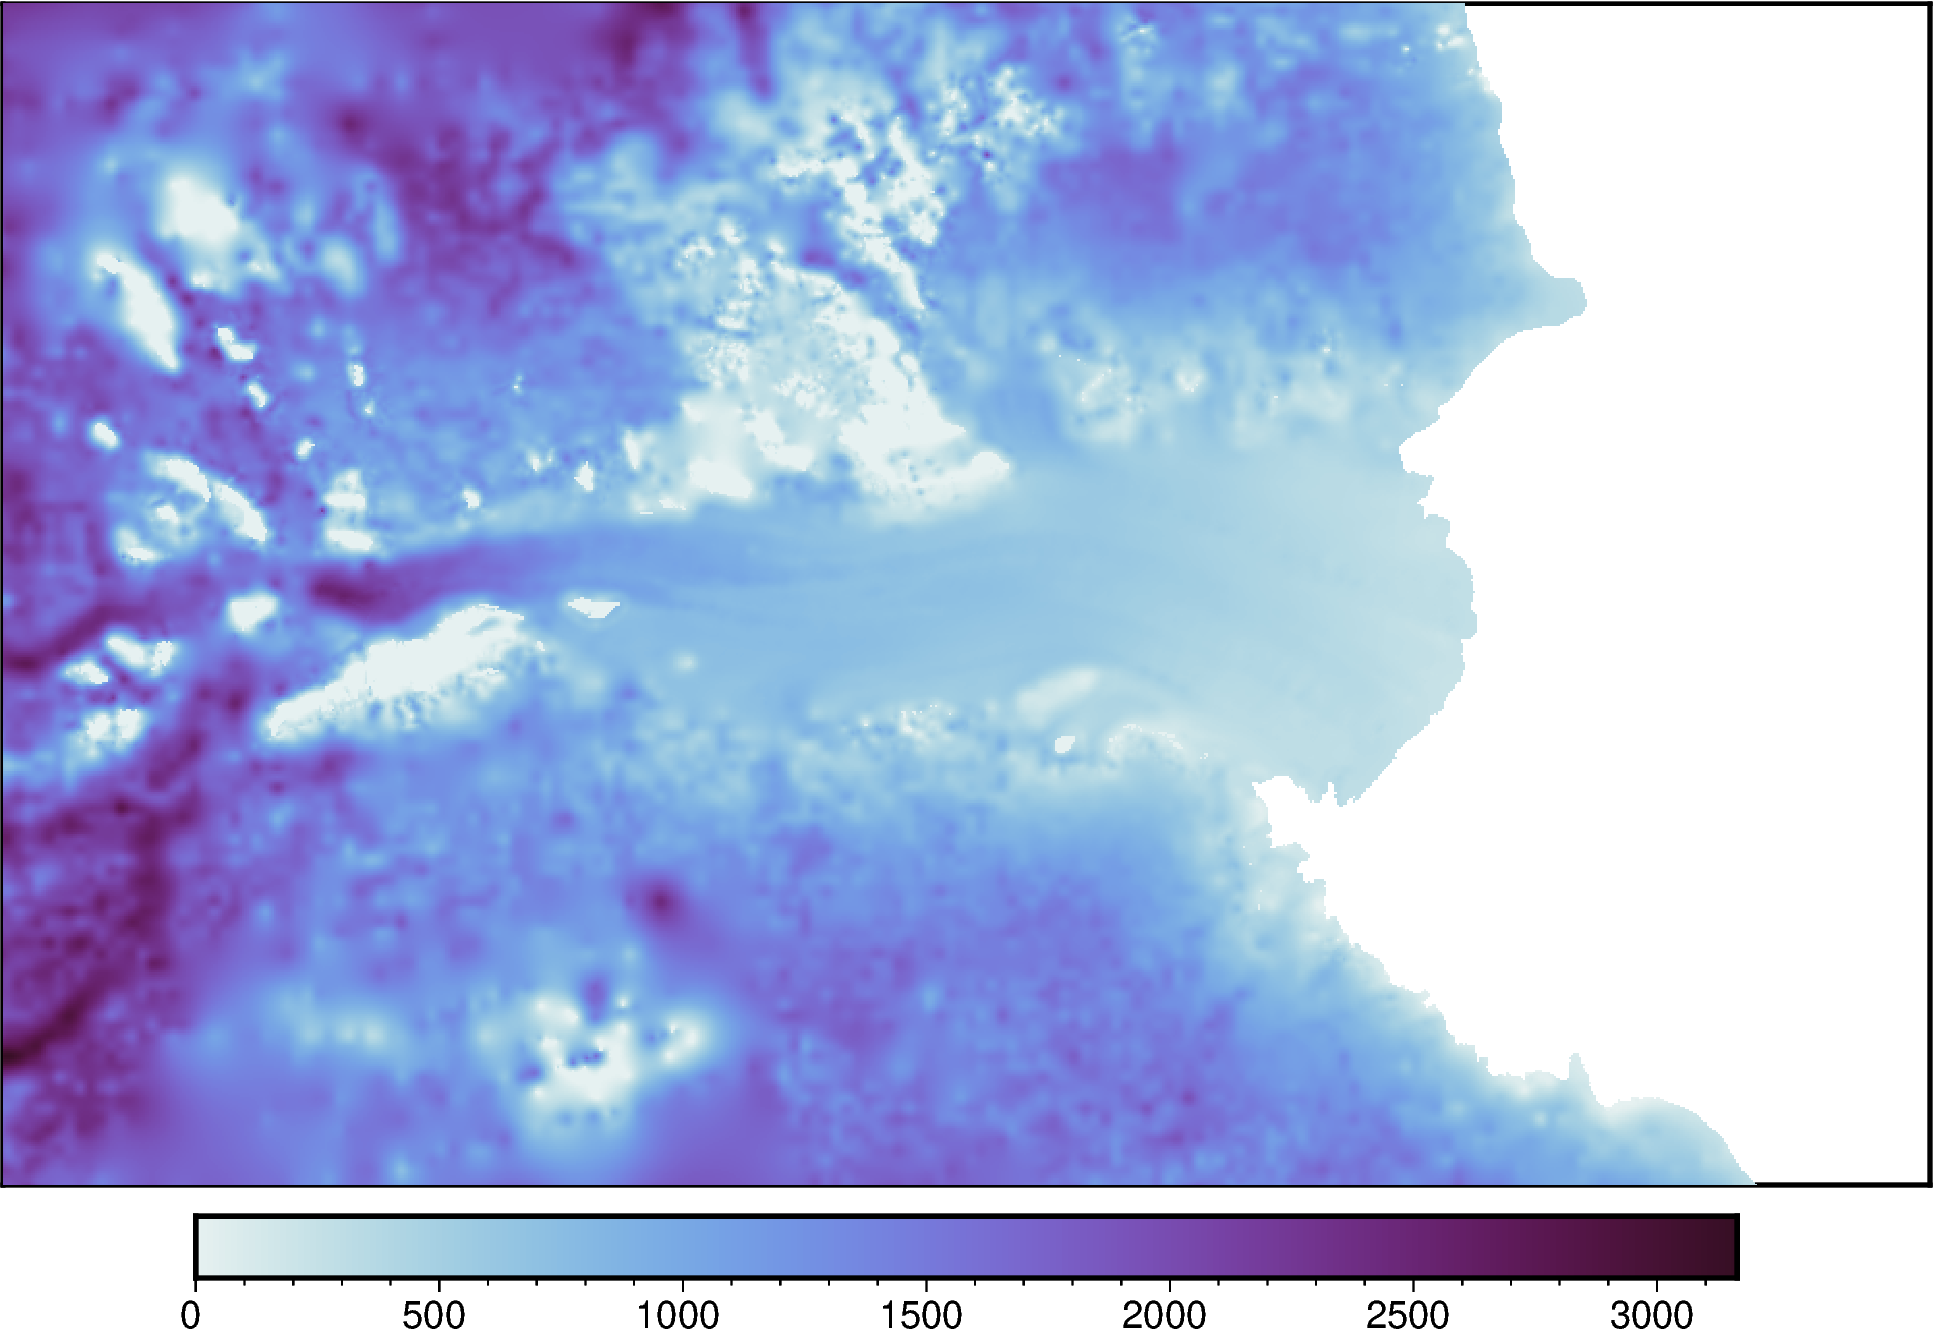
Create a simple map with default settings
[4]:
fig = maps.plot_grd(
    ice_thickness,
    cmap="dense",
)

fig.show(dpi=200)
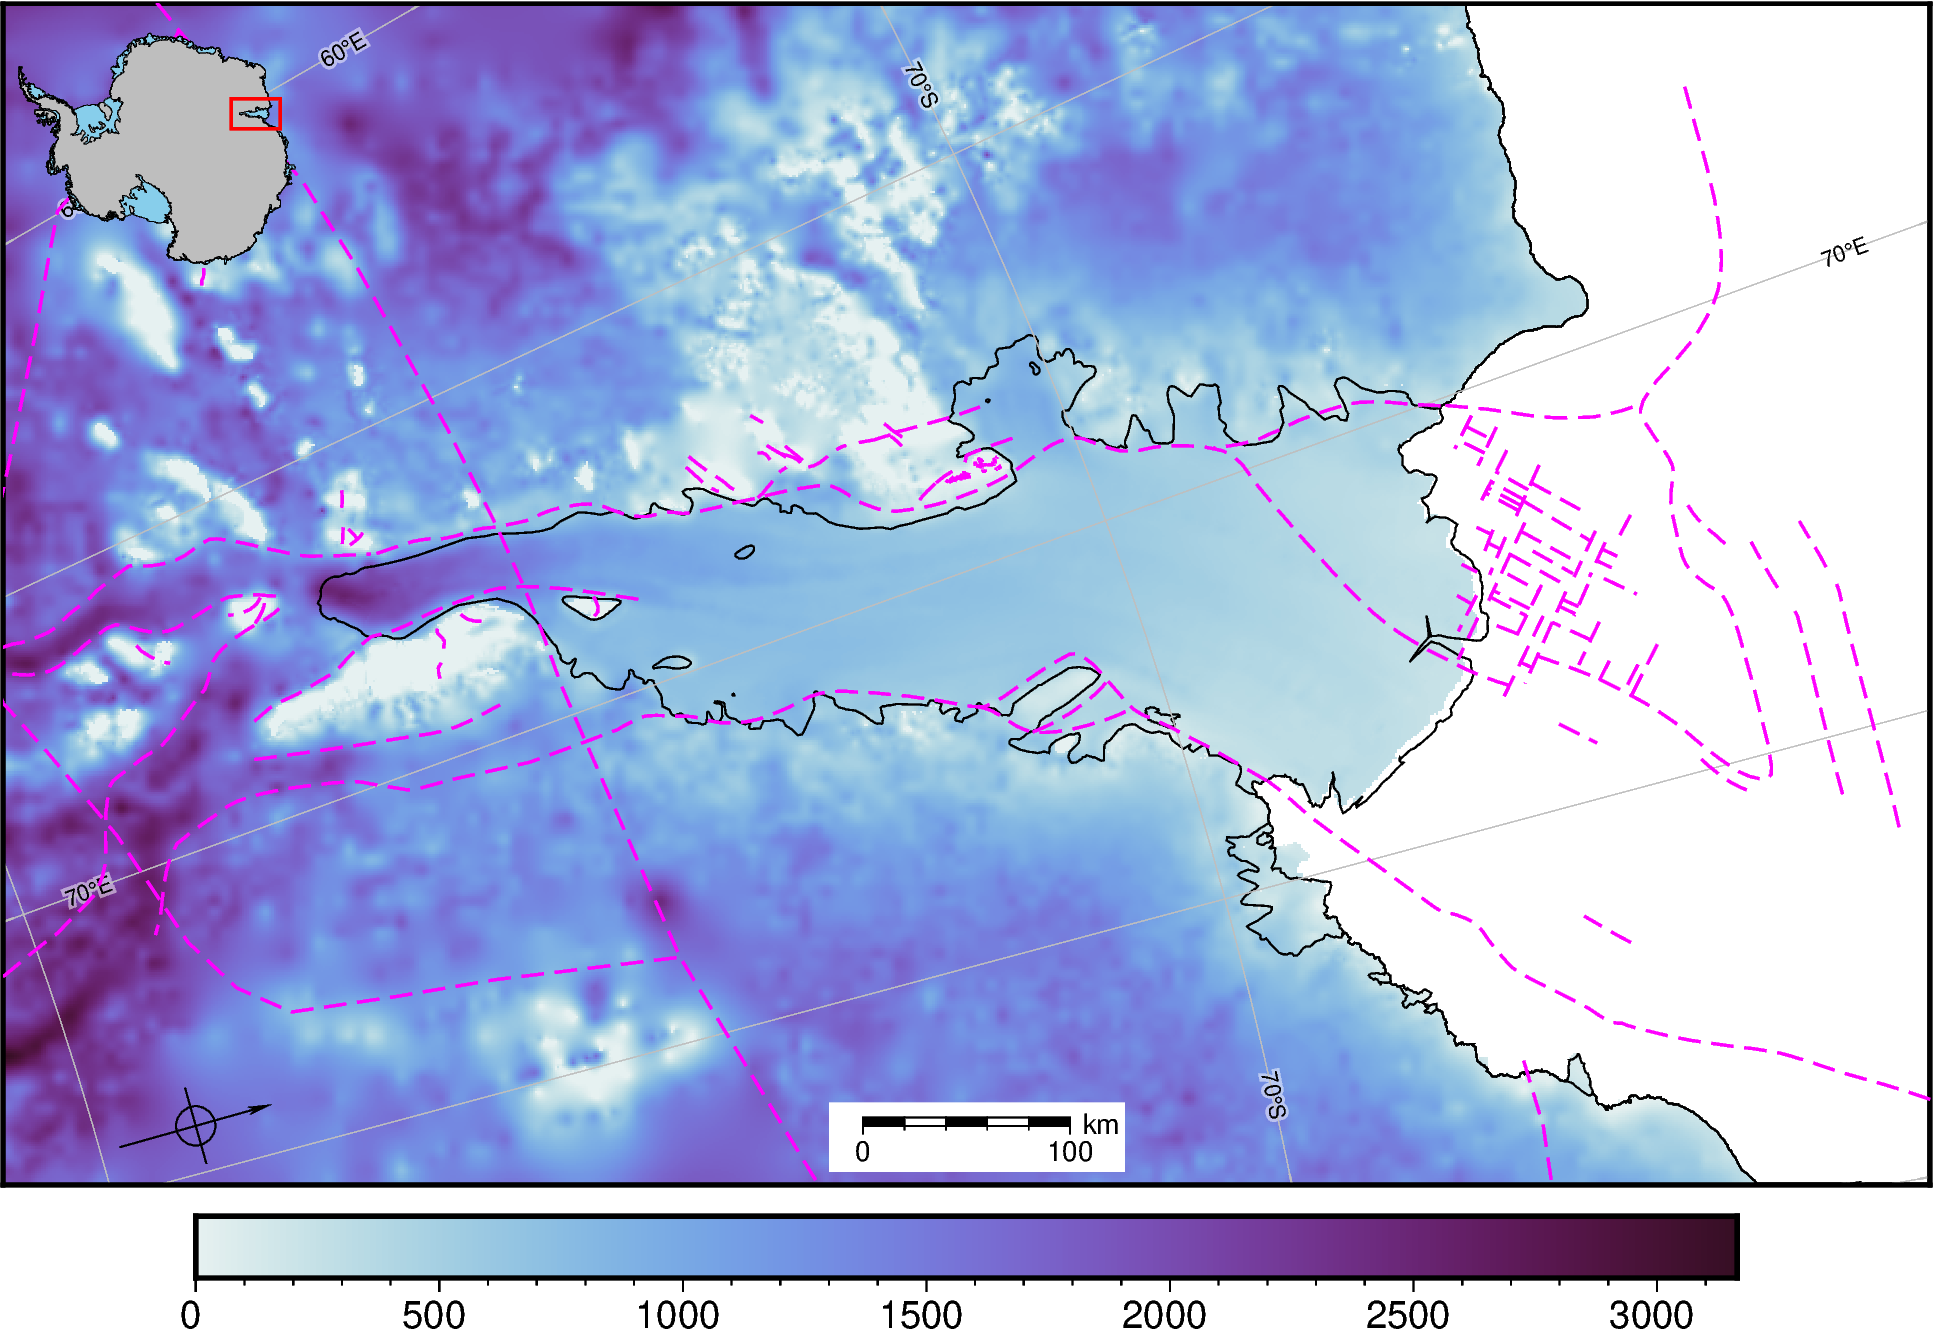
Add some built in map features. Each of these class functions have parameters which can be changed to alter the map, see the API reference for these.
[5]:
# add the coastline and groundingline
fig.add_coast()

# add some lat/lon lines
fig.add_gridlines(x_spacing=5, y_spacing=5)

# add some faults
fig.add_faults()

# add an inset map
fig.add_inset()

# add a scale bar
fig.add_scalebar()

# add a north arrow
fig.add_north_arrow(rose_size="2c")

fig.show(dpi=200)
gmtset [WARNING]: Representation of font type not recognized. Using default.
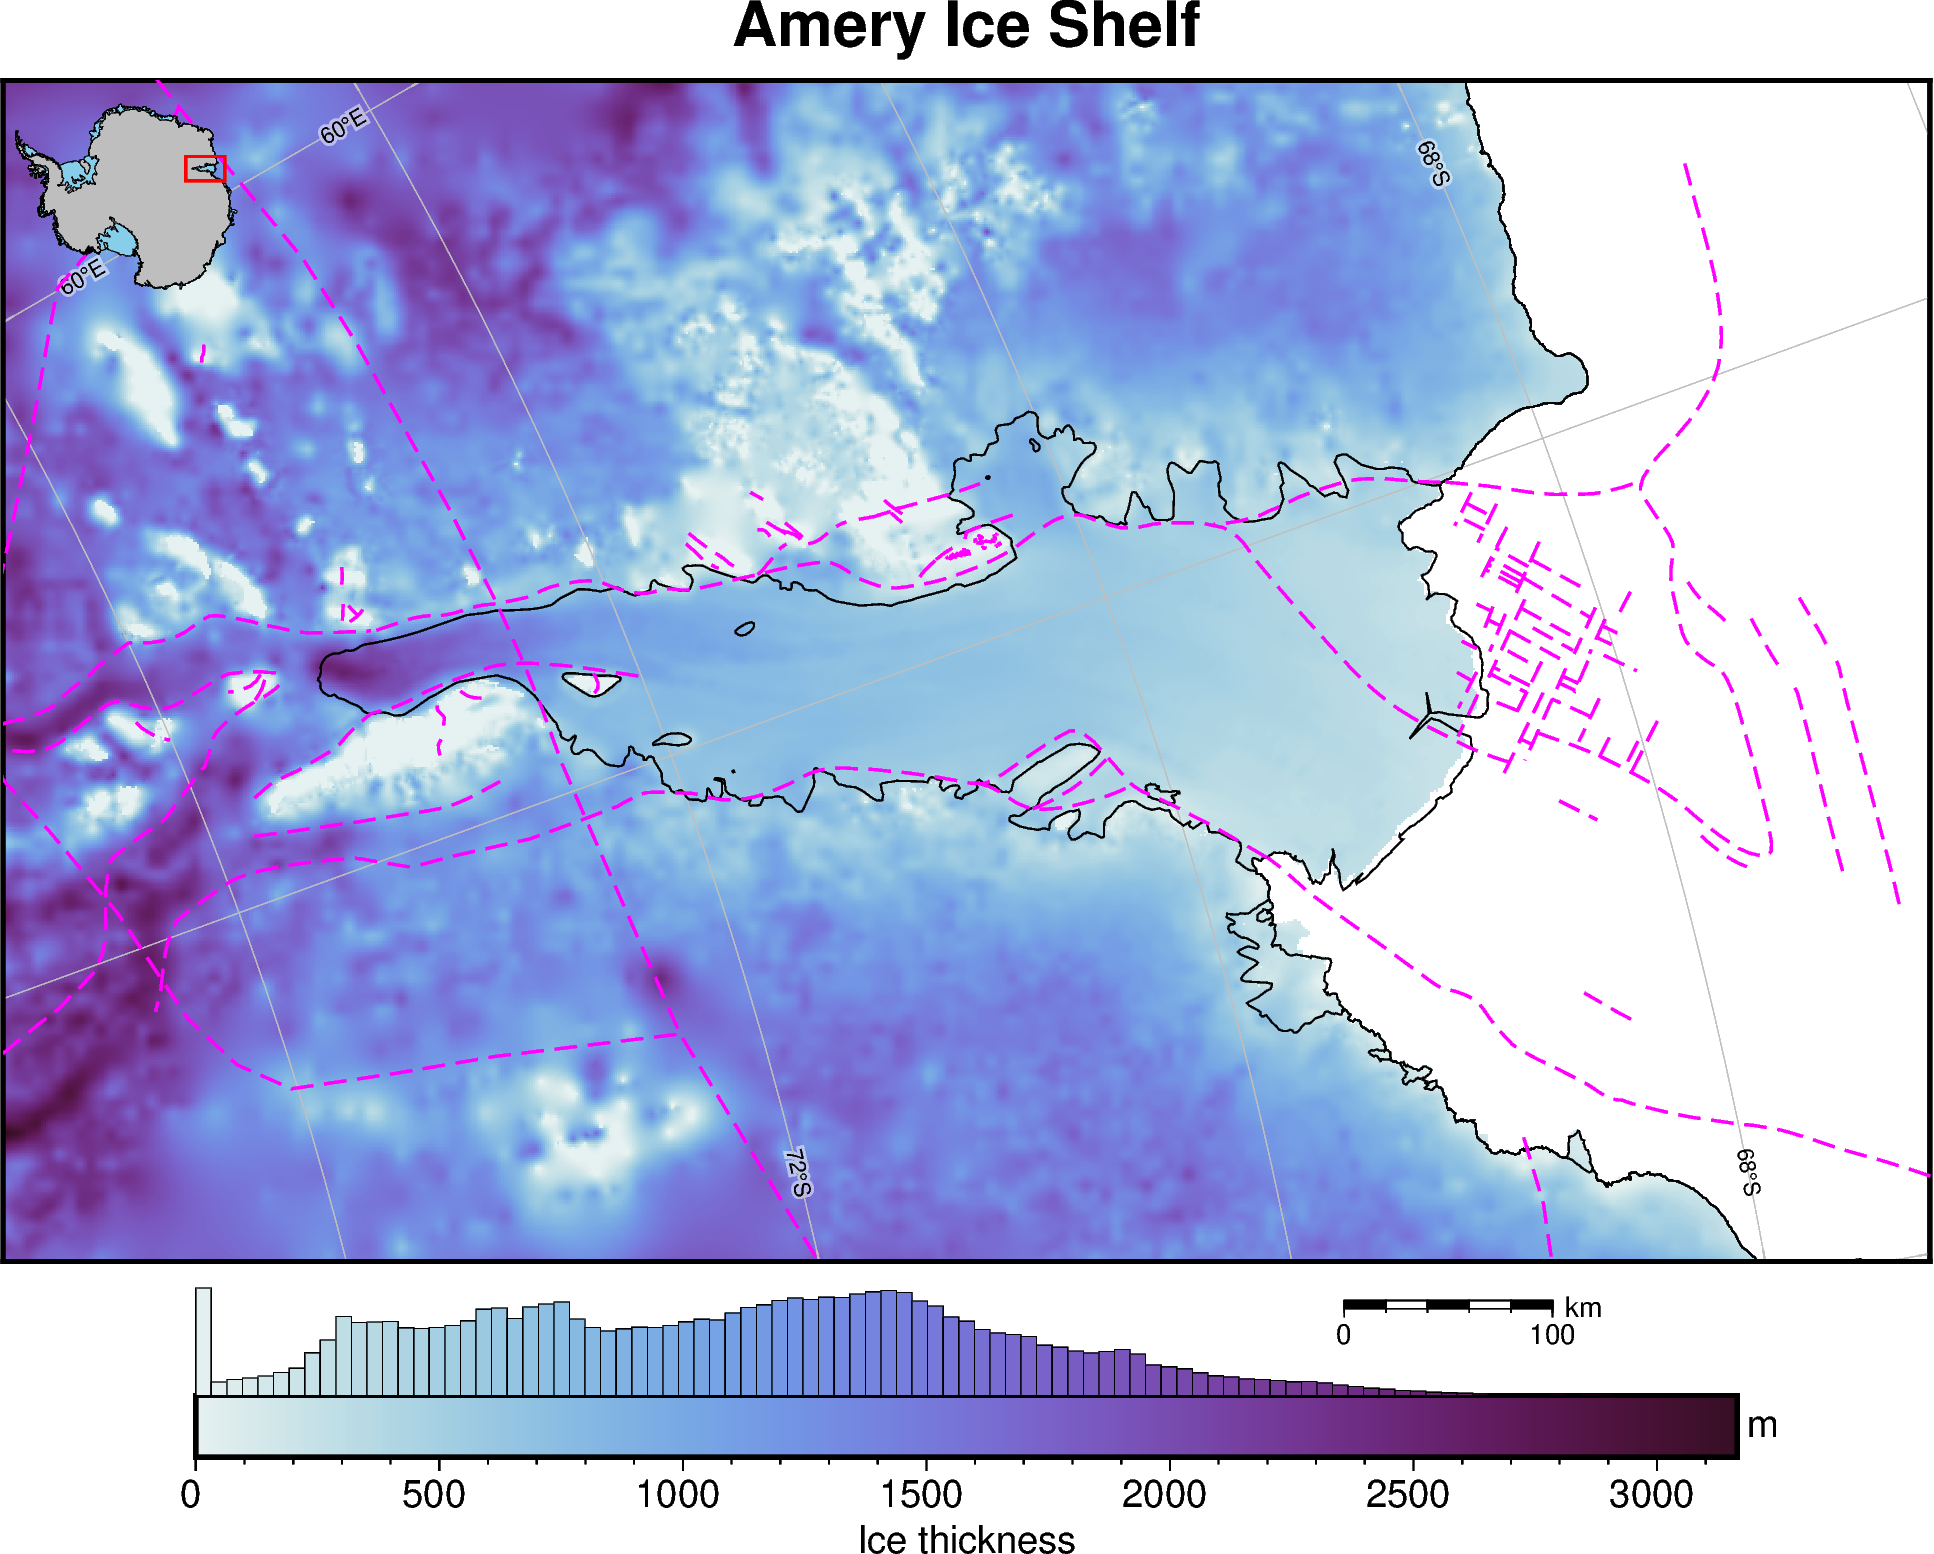
These can also all be called within the plot_grd() function
[6]:
fig = maps.plot_grd(
    ice_thickness,
    cmap="dense",  # set the colormap
    coast=True,
    title="Amery Ice Shelf",
    cbar_label="Ice thickness",  # add label to colorbar
    cbar_unit="m",  # add units to y-axis of colorbar
    faults=True,
    inset=True,  #  add inset map showing location
    inset_width=0.2,  # set width of inset map in percent of total figure width
    scalebar=True,  # add scalebar
    scalebar_position="n.75/-.04",
    gridlines=True,  # add lat/lon gridlines
    x_spacing=10,  # longitude interval (degrees)
    y_spacing=2,  # latitude interval (degrees)
    hist=True,  # add a histogram to the colorbar
    hist_bin_num=100,  # 100 bins
)

# display the figure
fig.show(dpi=200)
gmtset [WARNING]: Representation of font type not recognized. Using default.
[ ]: