Geoid Anomaly Grid#
Description: Gridded geoid heights from EIGEN-6C4 originally at a 10 arc-min resolution. Can be added to a ellipsoid-referenced elevation grid to convert it to be referenced to the geoid.
Dataset:
Uieda, Leonardo. “Fatiando a Terra Data: Earth - Geoid Height Grid at 10 Arc-Minute Resolution.” Zenodo, January 20, 2022. https://doi.org/10.5281/zenodo.5882205.
Associated paper:
Förste, Christoph, Sean.L. Bruinsma, Oleg Abrikosov, Jean-Michel Lemoine, Jean Charles Marty, Frank Flechtner, G. Balmino, F. Barthelmes, and R. Biancale. “EIGEN-6C4 The Latest Combined Global Gravity Field Model Including GOCE Data up to Degree and Order 2190 of GFZ Potsdam and GRGS Toulouse.” Application/octet-stream,application/octet-stream,application/zip. GFZ Data Services, 2014. https://doi.org/10.5880/ICGEM.2015.1.
[1]:
%%capture
%load_ext autoreload
%autoreload 2

from polartoolkit import fetch, maps, utils
[2]:
data = fetch.geoid(
    hemisphere="north"
    # available options
    # region,
    # spacing,
    # registration ("g" for gridline or "p" for pixel),
)
data
[2]:
<xarray.DataArray 'z' (y: 1401, x: 1401)> Size: 8MB
dask.array<open_dataset-z, shape=(1401, 1401), dtype=float32, chunksize=(351, 351), chunktype=numpy.ndarray>
Coordinates:
  * y        (y) float64 11kB -3.5e+06 -3.495e+06 ... 3.495e+06 3.5e+06
  * x        (x) float64 11kB -3.5e+06 -3.495e+06 ... 3.495e+06 3.5e+06
Attributes:
    Conventions:   CF-1.7
    title:
    history:       gmt grdsample @GMTAPI@-S-I-G-M-G-N-000000 -G@GMTAPI@-S-O-G...
    description:
    actual_range:  [-52.08355712890625, 68.41519927978516]
long_name: z[3]:
_ = utils.get_grid_info(data, print_info=True)
grid spacing: 5000.0 m
grid region: (-3500000.0, 3500000.0, -3500000.0, 3500000.0)
grid zmin: -52.0835571289
grid zmax: 68.4151992798
grid registration: g
[4]:
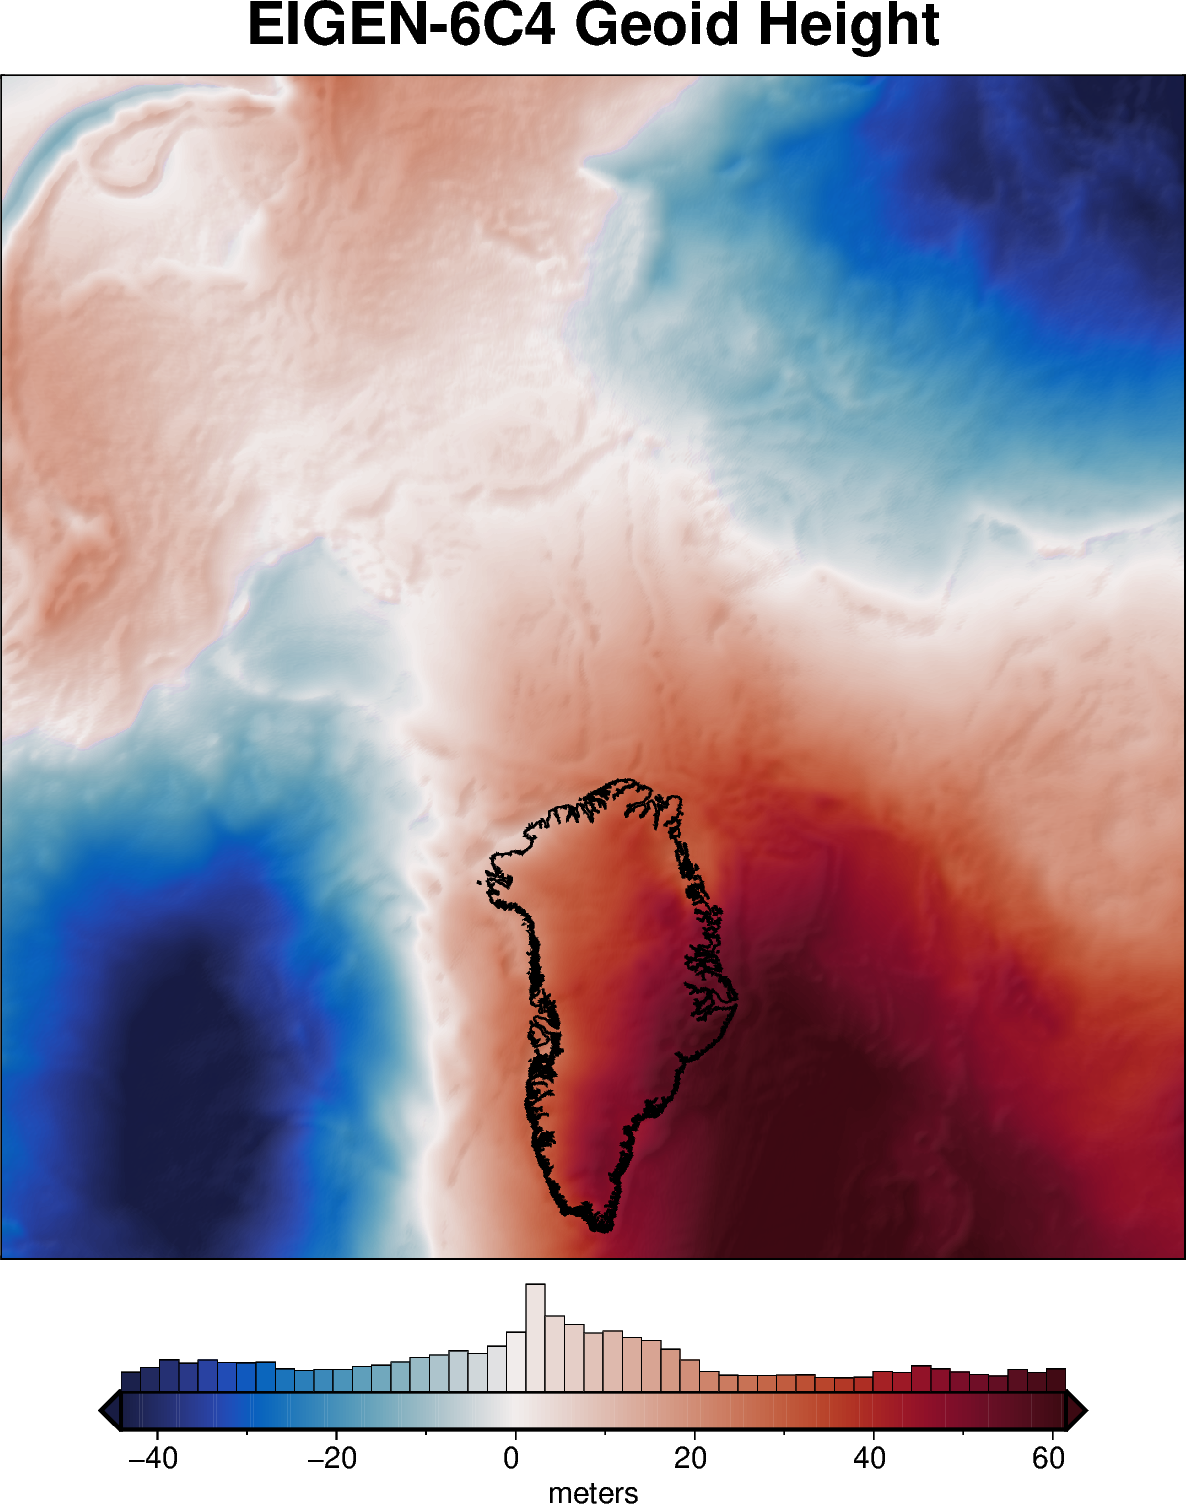
fig = maps.plot_grd(
    data,
    title="EIGEN-6C4 Geoid Height",
    cmap="balance+h0",
    coast=True,
    cbar_label="meters",
    hist=True,
    robust=True,
    hemisphere="north",
    shading="+nt.1",
)

fig.show(dpi=200)
[ ]: