MODIS MOG#
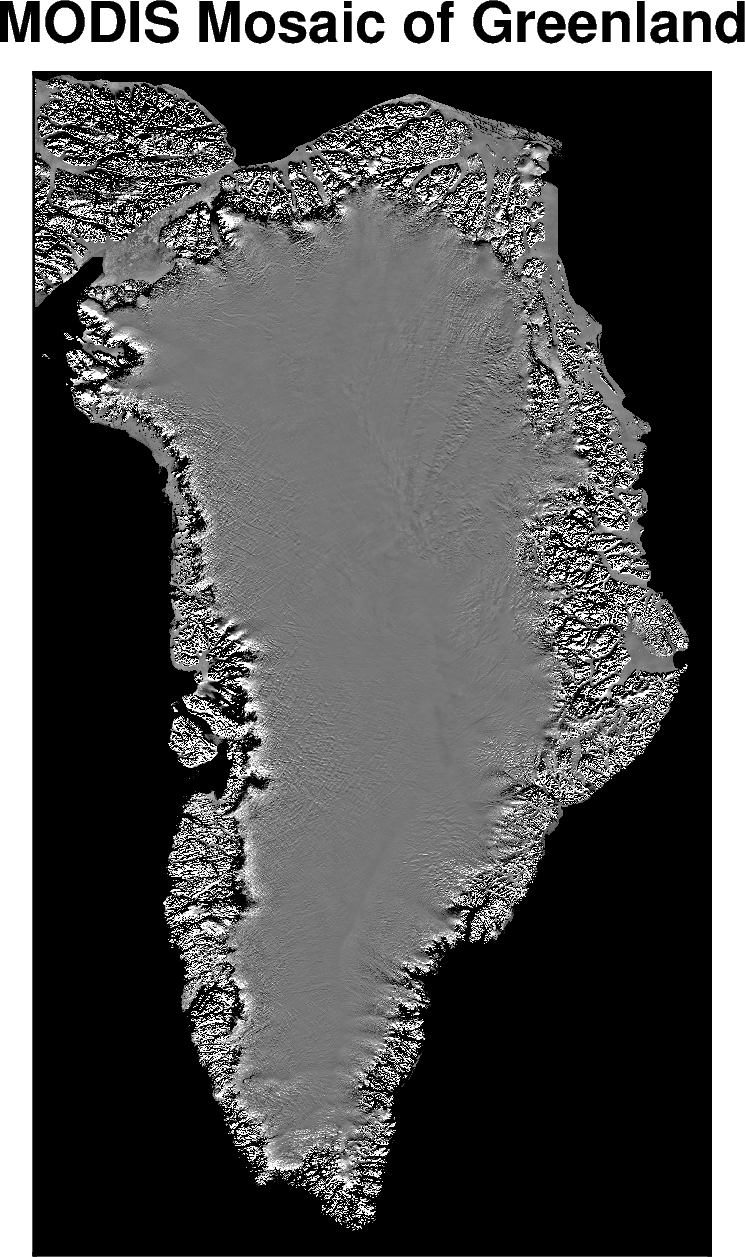
Description: MODIS optical image mosaic of Greenland.
Requires an EarthData login, see link for how to configure this.
Dataset:
Haran, T., J. Bohlander, T. A. Scambos, T. Painter, and M. Fahnestock. “MEaSUREs MODIS Mosaic of Greenland (MOG) 2005, 2010, and 2015 Image Maps, Version 2.” NASA National Snow and Ice Data Center Distributed Active Archive Center, 2018. https://doi.org/10.5067/9ZO79PHOTYE5.
Associated paper:
N.A.
[19]:
%%capture
%load_ext autoreload
%autoreload 2

import os

from polartoolkit import fetch, maps, regions
[20]:
# set default to northern hemisphere for this notebook
os.environ["POLARTOOLKIT_HEMISPHERE"] = "north"
[32]:
fpath = fetch.modis(
    # choose which resolution to use
    version="500m",
    # version="100m"
)
fpath
[32]:
'/home/sungw937/.cache/pooch/polartoolkit/imagery/mog500_2015_hp1_v02.tif'
[ ]:
# instead of passing the imagery filepath to `plot_grid`, we can use the keyword argument
# `modis_basemap=True` to either `maps.plot_grd()` or `maps.basemap()`
fig = maps.basemap(
    region=regions.greenland,
    modis_basemap=True,
    title="MODIS Mosaic of Greenland",
    modis=True,  # this automatically uses a nice colorscale for modis data
)
fig.show(dpi=200)