Bedmachine Grids#
Description: Gridded data in EPSG 3031 projection. Topographic layers, uncertainties, and masks.
Requires an EarthData login, see link for how to configure this.
Dataset:
Morlighem, M. “MEaSUREs BedMachine Antarctica, Version 3.” NASA Snow and Ice Data Center Distributed Active Archive Center, 2022. https://nsidc.org/data/nsidc-0756/versions/3.
Associated paper:
Morlighem, Mathieu, Eric Rignot, Tobias Binder, Donald Blankenship, Reinhard Drews, Graeme Eagles, Olaf Eisen, et al. “Deep Glacial Troughs and Stabilizing Ridges Unveiled beneath the Margins of the Antarctic Ice Sheet.” Nature Geoscience 13, no. 2 (2020): 132–37. https://doi.org/10.1038/s41561-019-0510-8.
[1]:
%%capture
%load_ext autoreload
%autoreload 2

import pygmt

from polartoolkit import fetch, maps, regions, utils
[2]:
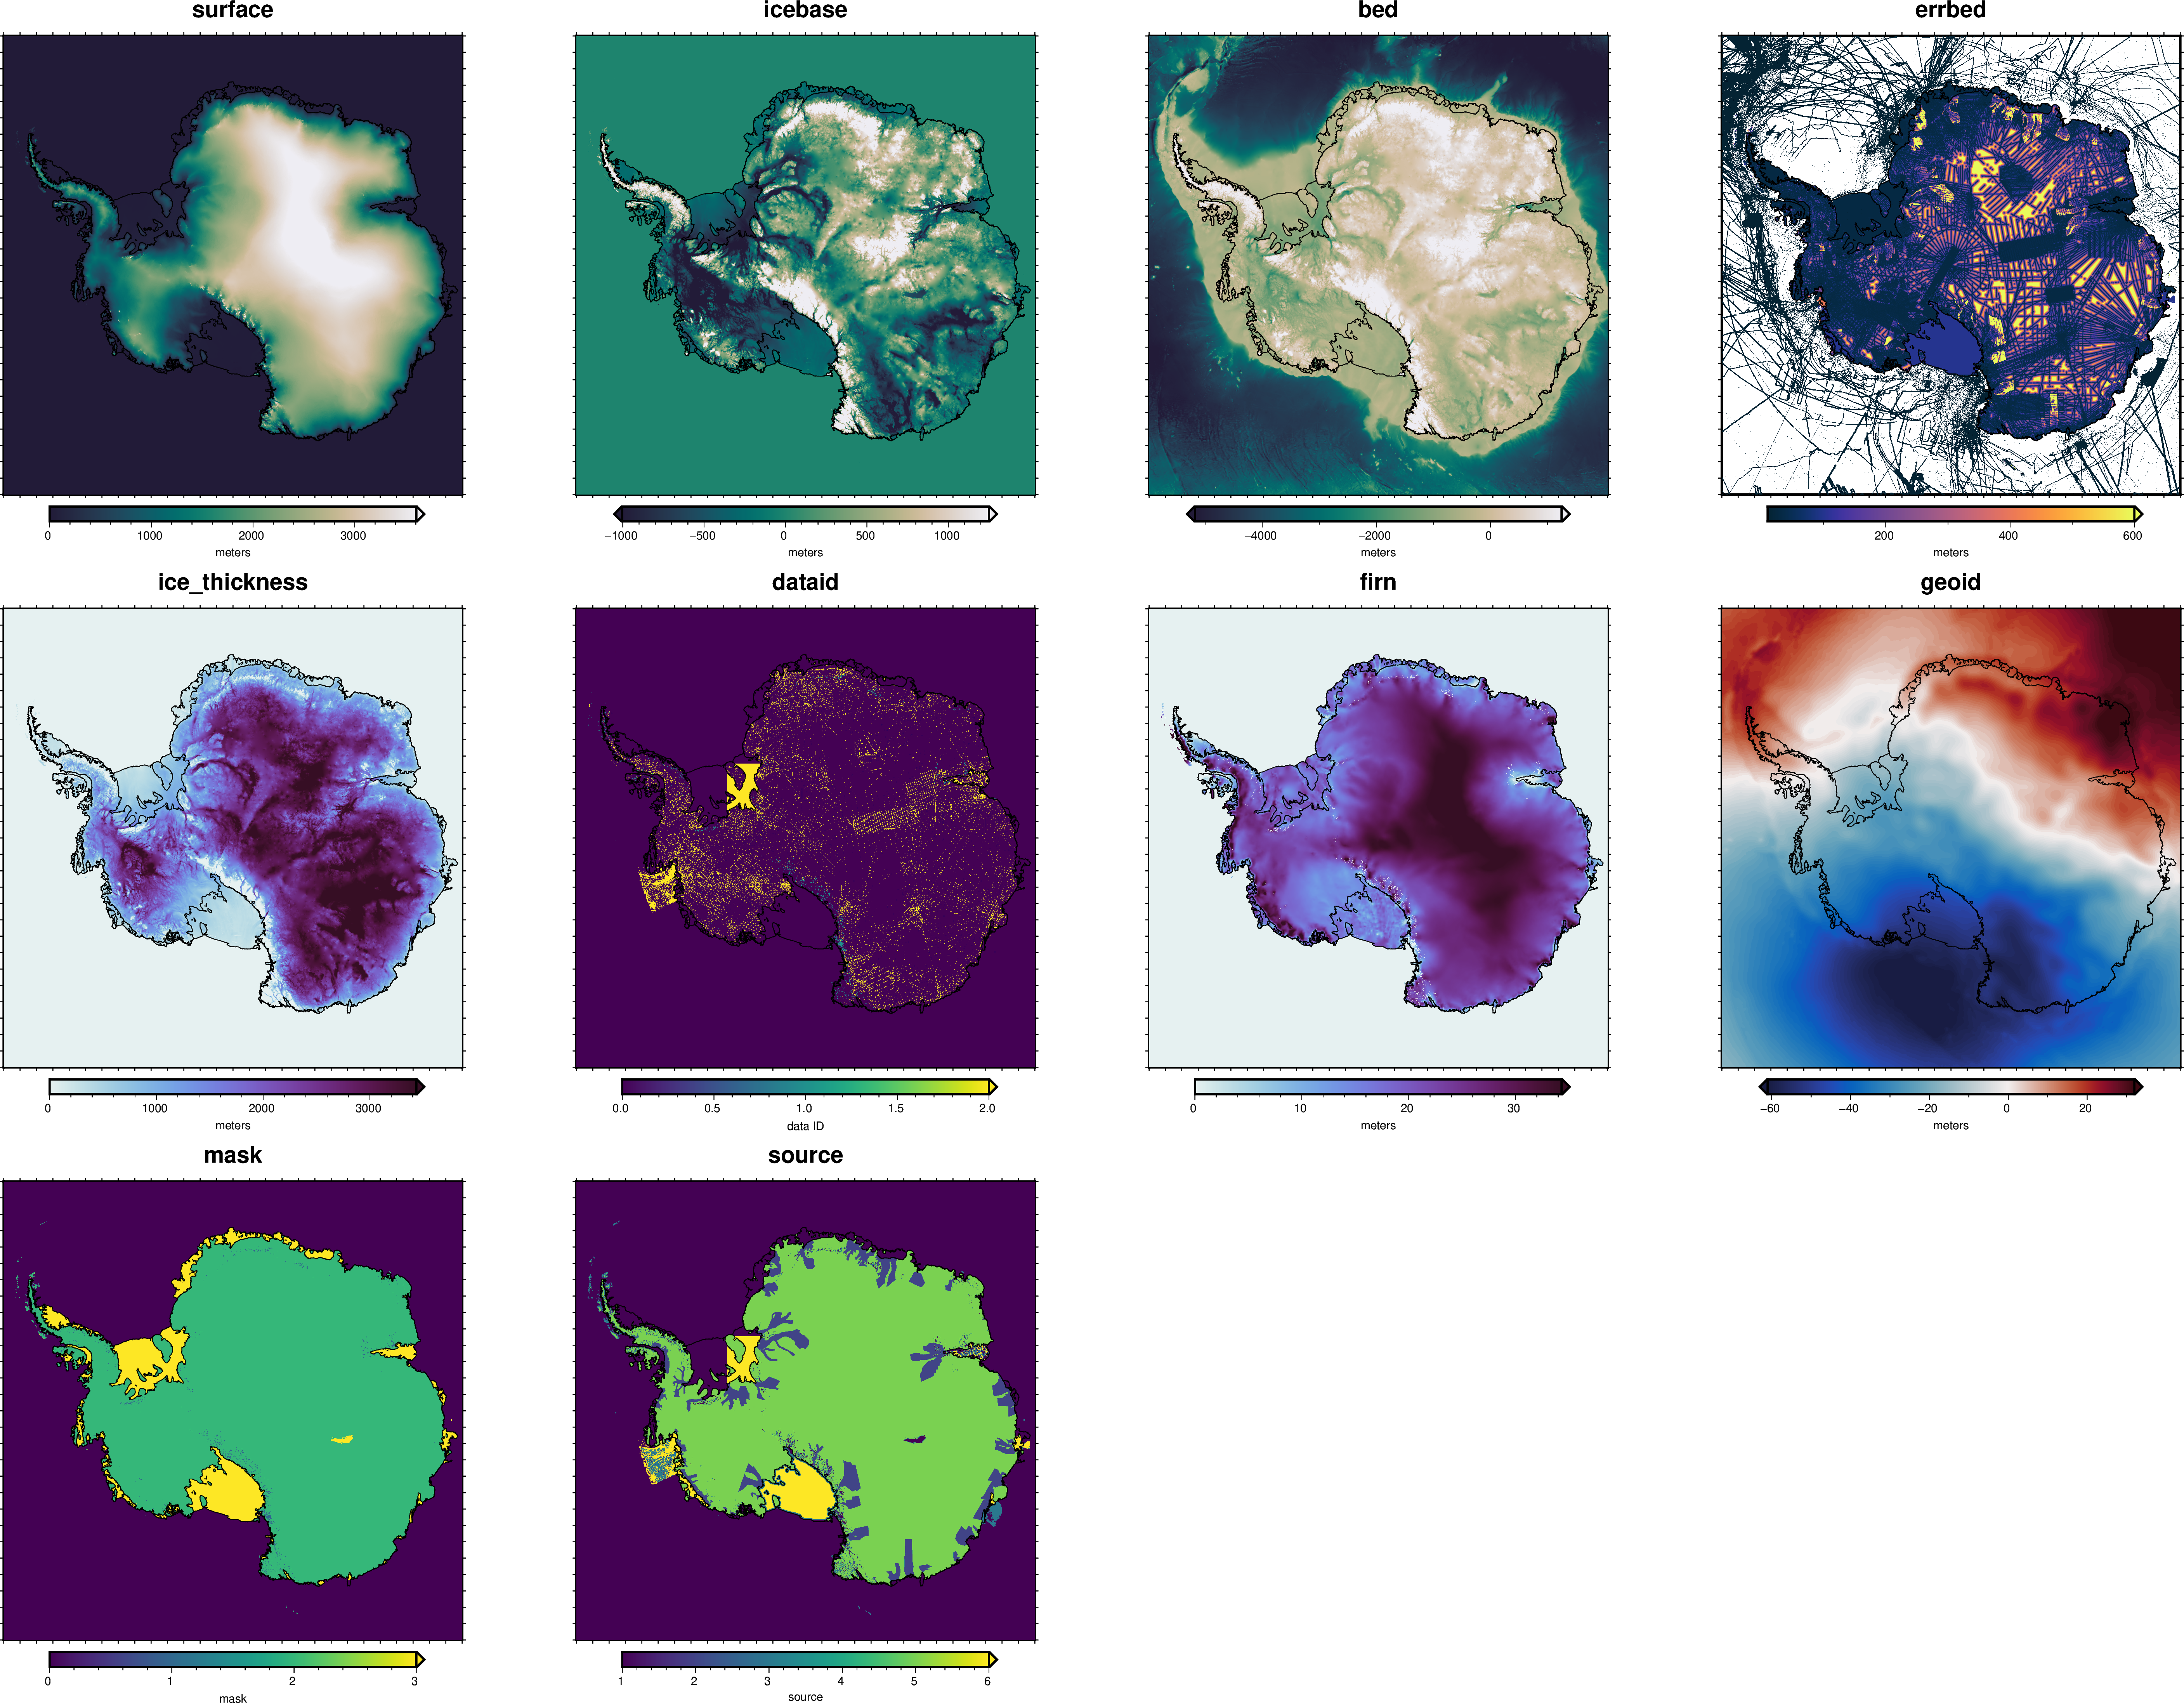
layer_names = [
    # topographies
    "surface",
    "icebase",
    "bed",
    # uncertainties
    "errbed",
    # others
    "ice_thickness",
    "dataid",
    "firn",
    "geoid",
    "mask",
    "source",
]

grids = []
for name in layer_names:
    data = fetch.bedmachine(
        layer=name,
        hemisphere="south",
        # available options
        # reference ("eigen-6c4" or "ellipsoid")
        # region,
        # spacing,
        # registration ("g" for gridline or "p" for pixel),
    )
    grids.append(data)
    print(f"Info for {name}")
    _ = utils.get_grid_info(data, print_info=True)
    print("##########")
Info for surface
grid spacing: 500.0 m
grid region: (-3333000.0, 3333000.0, -3333000.0, 3333000.0)
grid zmin: 0.0
grid zmax: 4818.15576172
grid registration: g
##########
Info for icebase
grid spacing: 500.0 m
grid region: (-3333000.0, 3333000.0, -3333000.0, 3333000.0)
grid zmin: -3827.19604492
grid zmax: 4818.15576172
grid registration: g
##########
Info for bed
grid spacing: 500.0 m
grid region: (-3333000.0, 3333000.0, -3333000.0, 3333000.0)
grid zmin: -8166.31542969
grid zmax: 4818.15576172
grid registration: g
##########
Info for errbed
grid spacing: 500.0 m
grid region: (-3333000.0, 3333000.0, -3333000.0, 3333000.0)
grid zmin: 10.0
grid zmax: 1000.0
grid registration: g
##########
Info for ice_thickness
grid spacing: 500.0 m
grid region: (-3333000.0, 3333000.0, -3333000.0, 3333000.0)
grid zmin: 0.0
grid zmax: 4822.79492188
grid registration: g
##########
Info for dataid
grid spacing: 500.0 m
grid region: (-3333000.0, 3333000.0, -3333000.0, 3333000.0)
grid zmin: 0.0
grid zmax: 10.0
grid registration: g
##########
Info for firn
grid spacing: 500.0 m
grid region: (-3333000.0, 3333000.0, -3333000.0, 3333000.0)
grid zmin: 0.0
grid zmax: 50.9211807251
grid registration: g
##########
Info for geoid
grid spacing: 500.0 m
grid region: (-3333000.0, 3333000.0, -3333000.0, 3333000.0)
grid zmin: -66.0
grid zmax: 52.0
grid registration: g
##########
Info for mask
grid spacing: 500.0 m
grid region: (-3333000.0, 3333000.0, -3333000.0, 3333000.0)
grid zmin: 0.0
grid zmax: 4.0
grid registration: g
##########
Info for source
grid spacing: 500.0 m
grid region: (-3333000.0, 3333000.0, -3333000.0, 3333000.0)
grid zmin: 1.0
grid zmax: 10.0
grid registration: g
##########
[ ]:
cmaps = [
    "rain",
    "rain",
    "rain",
    "thermal",
    "dense",
    "viridis",
    "dense",
    "balance+h0",
    "viridis",
    "viridis",
]
cbar_labels = ["meters"] * 5 + ["data ID", "meters", "meters", "mask", "source"]

reverse_cpts = [True] * 3 + [False] * 7

subplot_dimensions = utils.square_subplots(len(layer_names))

region = regions.antarctica
_, _, fig_width, fig_height = utils.set_proj(
    region,
    hemisphere="south",
    fig_height=15,
)

fig = pygmt.Figure()

with fig.subplot(
    nrows=subplot_dimensions[0],
    ncols=subplot_dimensions[1],
    subsize=(fig_width, fig_height),
    frame="f",
    margins="1.5c",
):
    for i, (layer, grid) in enumerate(zip(layer_names, grids)):
        with fig.set_panel(panel=i):
            # plot the grids
            maps.plot_grd(
                grid,
                fig=fig,
                title=layer,
                origin_shift=None,
                region=region,
                coast=True,
                robust=True,
                hemisphere="south",
                cmap=cmaps[i],
                cbar_label=cbar_labels[i],
                reverse_cpt=reverse_cpts[i],
            )
fig.show(dpi=200)
The Kernel crashed while executing code in the current cell or a previous cell.

Please review the code in the cell(s) to identify a possible cause of the failure.

Click <a href='https://aka.ms/vscodeJupyterKernelCrash'>here</a> for more info.

View Jupyter <a href='command:jupyter.viewOutput'>log</a> for further details.
[ ]: