ETOPO1 Surface Topography#
Description: A grid of surface topography originally at 10 arc-min resolution.
Dataset:
Uieda, Leonardo. “Fatiando a Terra Data: Earth - Topography Grid at 10 Arc-Minute Resolution.” Zenodo, January 20, 2022. https://doi.org/10.5281/zenodo.5882203.
Associated paper:
“ETOPO1 1 Arc-Minute Global Relief Model: Procedures, Data Sources and Analysis.” National Geophysical Data Center, NOAA, 2009. https://doi.org/10.7289/V5C8276M.
[1]:
%%capture
%load_ext autoreload
%autoreload 2

from polartoolkit import fetch, maps, utils
[2]:
data = fetch.etopo(
    hemisphere="south",
    # available options
    # region,
    # spacing,
    # registration ("g" for gridline or "p" for pixel),
)
data
100%|██████████████████████████████████████| 2.75M/2.75M [00:00<00:00, 673MB/s]
grdproject [WARNING]: x_inc does not divide 180; geographic boundary condition changed to natural.
grdsample [WARNING]: Output sampling interval in x exceeds input interval and may lead to aliasing.
grdsample [WARNING]: Output sampling interval in y exceeds input interval and may lead to aliasing.
[2]:
<xarray.DataArray 'z' (y: 1401, x: 1401)> Size: 8MB
array([[-4963.043 , -4967.358 , -4966.7637, ..., -4203.8423, -4212.897 ,
        -4218.639 ],
       [-4968.4956, -4972.7715, -4972.498 , ..., -4197.688 , -4206.7515,
        -4212.28  ],
       [-4974.988 , -4979.917 , -4980.9595, ..., -4190.6455, -4200.024 ,
        -4205.6553],
       ...,
       [-5394.24  , -5399.4473, -5401.7217, ..., -2656.776 , -2560.7532,
        -2462.7178],
       [-5372.7065, -5379.143 , -5383.846 , ..., -2618.7253, -2520.7961,
        -2420.6814],
       [-5352.609 , -5359.702 , -5366.1016, ..., -2585.015 , -2484.801 ,
        -2385.1565]], shape=(1401, 1401), dtype=float32)
Coordinates:
  * y        (y) float64 11kB -3.5e+06 -3.495e+06 ... 3.495e+06 3.5e+06
  * x        (x) float64 11kB -3.5e+06 -3.495e+06 ... 3.495e+06 3.5e+06
Attributes:
    Conventions:   CF-1.7
    title:
    history:       gmt grdsample @GMTAPI@-S-I-G-M-G-N-000000 -G@GMTAPI@-S-O-G...
    description:
    actual_range:  [-7946.32617188  4089.17773438]
long_name: z[3]:
_ = utils.get_grid_info(data, print_info=True)
grid spacing: 5000.0 m
grid region: (-3500000.0, 3500000.0, -3500000.0, 3500000.0)
grid zmin: -7946.32617188
grid zmax: 4089.17773438
grid registration: g
[4]:
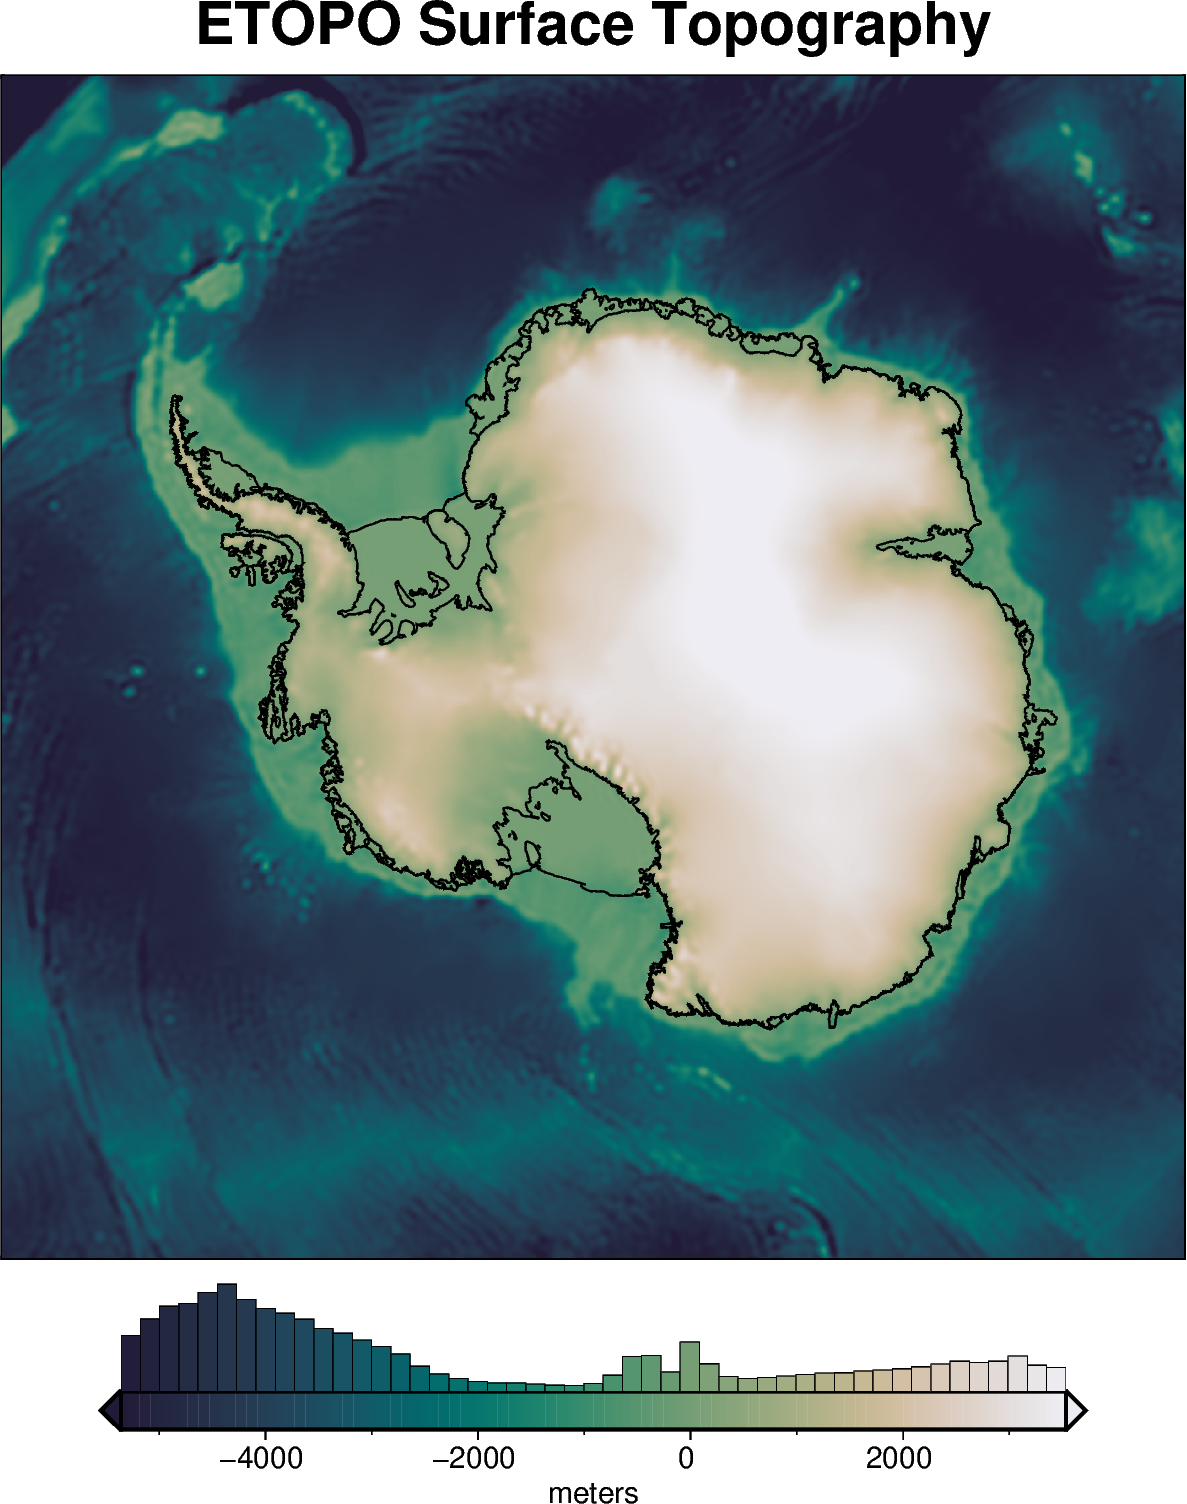
fig = maps.plot_grd(
    data,
    title="ETOPO Surface Topography",
    coast=True,
    cbar_label="meters",
    hist=True,
    robust=True,
    cmap="rain",
    reverse_cpt=True,
    hemisphere="south",
)

fig.show(dpi=200)
[ ]: