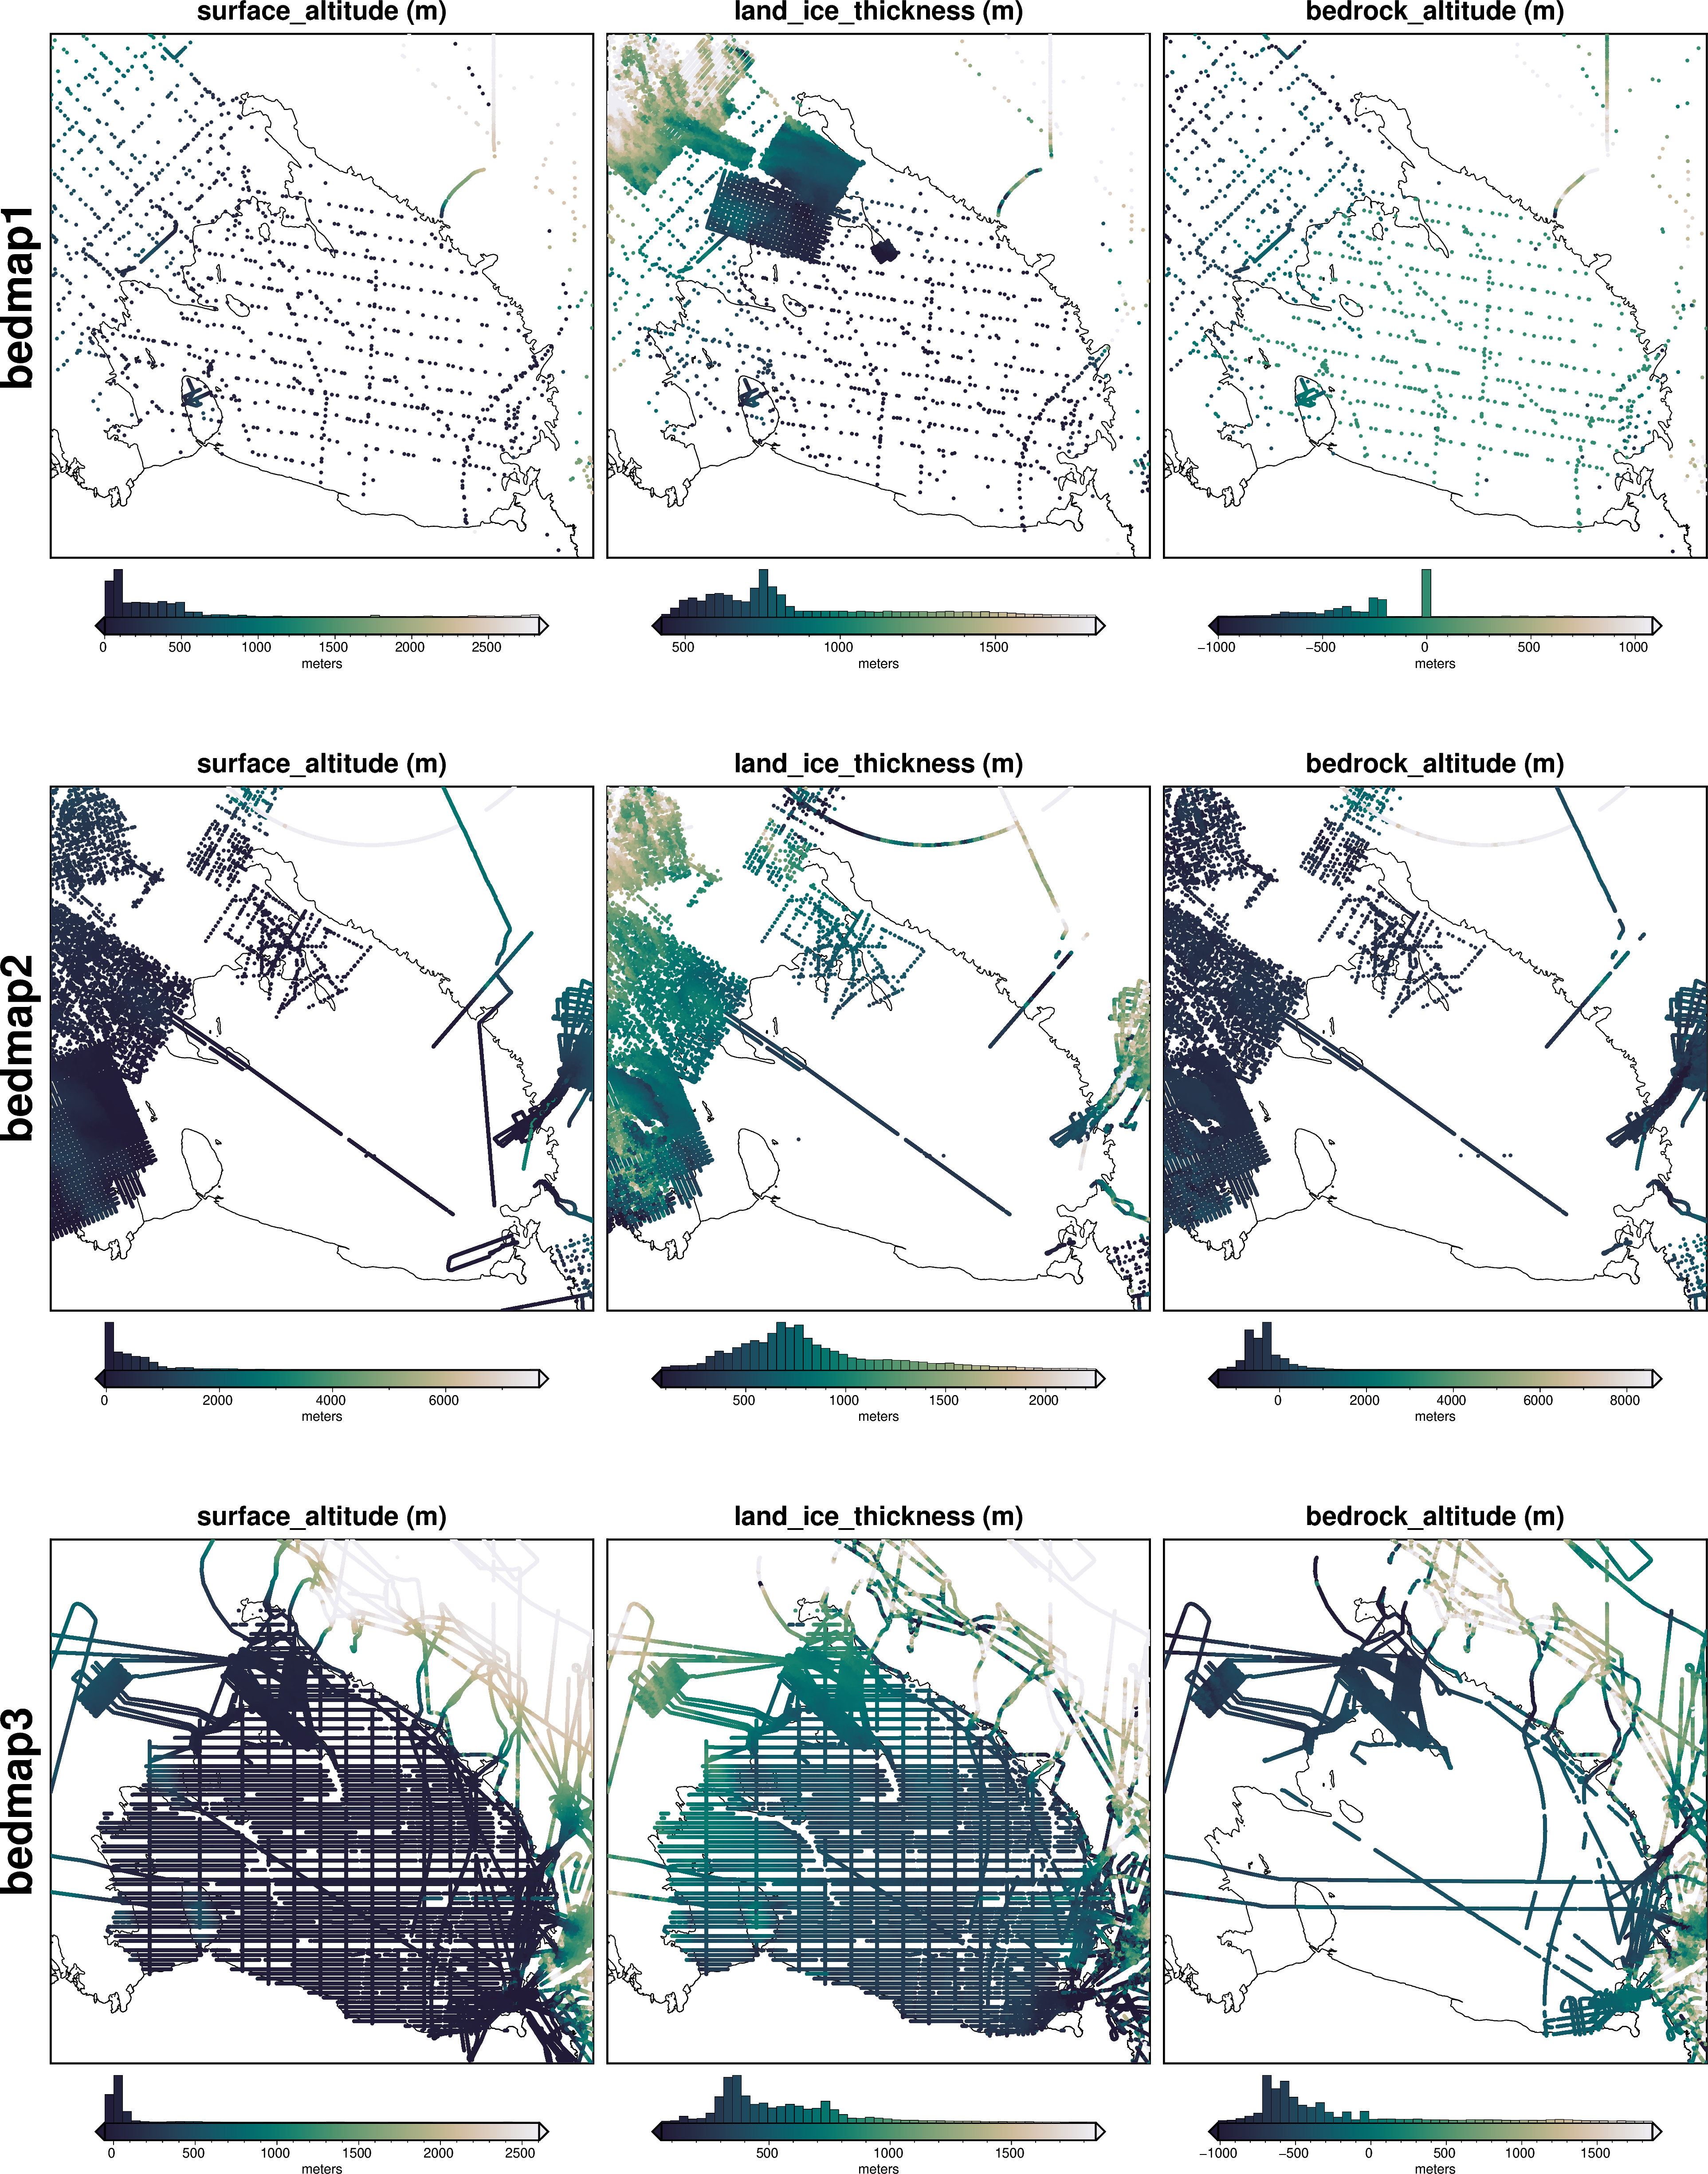
Bedmap Point Data#
Description: Individual data points from Bedmap 1 2 and 3 for Antarctica.
Datasets:
Lythe, M., Vaughan, D., BEDMAP 1, consortia, Fremand, A., & Bodart, J. (2022). BEDMAP1 - Ice thickness, bed and surface elevation for Antarctica - standardised data points (Version 1.0) [Data set]. NERC EDS UK Polar Data Centre. https://doi.org/10.5285/F64815EC-4077-4432-9F55-0CE230F46029
Fretwell, P., Fremand, A., Bodart, J., Pritchard, H., Vaughan, D., Bamber, J., Barrand, N., Bell, R. E., Bianchi, C., Bingham, R., Blankenship, D., Casassa, G., Catania, G., Callens, D., Conway, H., Cook, A., Corr, H., Damaske, D., Damn, V., … Zirizzotti, A. (2022). BEDMAP2 - Ice thickness, bed and surface elevation for Antarctica - standardised data points (Version 1.0) [Data set]. NERC EDS UK Polar Data Centre. https://doi.org/10.5285/2FD95199-365E-4DA1-AE26-3B6D48B3E6AC
Fremand, A., Fretwell, P., Bodart, J., Pritchard, H., Aitken, A., Bamber, J., Bell, R. E., Bianchi, C., Bingham, R., Blankenship, D., Casassa, G., Catania, G., Christianson, K., Conway, H., Corr, H., Cui, X., Damaske, D., Damm, V., Drews, R., … Zirizzotti, A. (2022). BEDMAP3 - Ice thickness, bed and surface elevation for Antarctica - standardised data points (Version 1.0) [Data set]. NERC EDS UK Polar Data Centre. https://doi.org/10.5285/91523FF9-D621-46B3-87F7-FFB6EFCD1847
Associated papers:
Frémand, Alice C., Peter Fretwell, Julien Bodart, Hamish D. Pritchard, Alan Aitken, Jonathan L. Bamber, Robin Bell, et al. “Antarctic Bedmap Data: FAIR Sharing of 60 Years of Ice Bed, Surface and Thickness Data.” Earth System Science Data Discussions, November 22, 2022, 1–25. https://doi.org/10.5194/essd-2022-355.
Lythe, Matthew B., and David G. Vaughan. “BEDMAP: A New Ice Thickness and Subglacial Topographic Model of Antarctica.” Journal of Geophysical Research: Solid Earth 106, no. B6 (2001): 11335–51. https://doi.org/10.1029/2000JB900449.
[1]:
%load_ext autoreload
%autoreload 2


from polartoolkit import fetch, maps, regions
[3]:
# region = regions.antarctica
region = regions.ross_ice_shelf

version_names = [
    "bedmap1",
    "bedmap2",
    "bedmap3",
]

dfs = []
for name in version_names:
    df = fetch.bedmap_points(
        version=name,
        # available options
        region=region,
    )
    dfs.append(df)
Downloading data from 'https://ramadda.data.bas.ac.uk/repository/entry/show/UK+Polar+Data+Centre/DOI/BEDMAP3+-+Ice+thickness%2C+bed+and+surface+elevation+for+Antarctica+-+standardised+data+points?entryid=91523ff9-d621-46b3-87f7-ffb6efcd1847&output=zip.zipgroup' to file '/home/sungw937/.cache/pooch/polartoolkit/topography/bedmap3_point_data.zip'.
0.00B [00:00, ?B/s]
SHA256 hash of downloaded file: 7fd2e1cb68a6b42fcd0191e8740bd1e511aaf8c1e5b6d29b4700149c6f6a91e2
Use this value as the 'known_hash' argument of 'pooch.retrieve' to ensure that the file hasn't changed if it is downloaded again in the future.
/home/sungw937/miniforge3/envs/polartoolkit/lib/python3.12/site-packages/pooch/core.py:251: UserWarning: this file is large (14 Gb!) and will take some time to download and preprocess!
  return processor(str(full_path), action, None)
Unzipping contents of '/home/sungw937/.cache/pooch/polartoolkit/topography/bedmap3_point_data.zip' to '/home/sungw937/.cache/pooch/polartoolkit/topography/bedmap3_point_data'
[4]:
data_to_plot = [
    # bedmap1
    [
        "surface_altitude (m)",
        "land_ice_thickness (m)",
        "bedrock_altitude (m)",
    ],
    # bedmap2
    [
        "surface_altitude (m)",
        "land_ice_thickness (m)",
        "bedrock_altitude (m)",
    ],
    # bedmap3
    [
        "surface_altitude (m)",
        "land_ice_thickness (m)",
        "bedrock_altitude (m)",
    ],
]
[ ]:
for row, (version, df) in enumerate(zip(version_names, dfs)):
    for col, data_str in enumerate(data_to_plot[row]):
        yshift_amount = -1.1
        if (col == 0) and (row == 0):
            origin_shift = "initialize"
            fig = None
            xshift_amount = 1
        elif col == 0:
            # shift left and down
            origin_shift = "both"
            xshift_amount = -1 * len(data_to_plot[row - 1]) + 1
        else:
            origin_shift = "x"
            xshift_amount = 1

        points = df.dropna(subset=data_str)
        fig = maps.basemap(
            fig=fig,
            origin_shift=origin_shift,
            xshift_amount=xshift_amount,
            yshift_amount=yshift_amount,
            region=region,
            coast=True,
            title=data_str,
            hemisphere="south",
            points=points[::10],  # only plot every 10th point
            points_fill=data_str,
            points_cmap="rain",
            points_pen=None,
            points_style="c.1c",
            robust=True,
            colorbar=True,
            hist=True,
            reverse_cpt=True,
            cbar_label="meters",
        )
        if col == 0:
            fig.text(
                position="LM",
                justify="CM",
                offset="-1/0",
                angle=90,
                text=version,
                font="35p,Helvetica-Bold",
                no_clip=True,
            )

fig.show(dpi=200)
The Kernel crashed while executing code in the current cell or a previous cell.

Please review the code in the cell(s) to identify a possible cause of the failure.

Click <a href='https://aka.ms/vscodeJupyterKernelCrash'>here</a> for more info.

View Jupyter <a href='command:jupyter.viewOutput'>log</a> for further details.
[ ]: