Geoid Anomaly Grid#
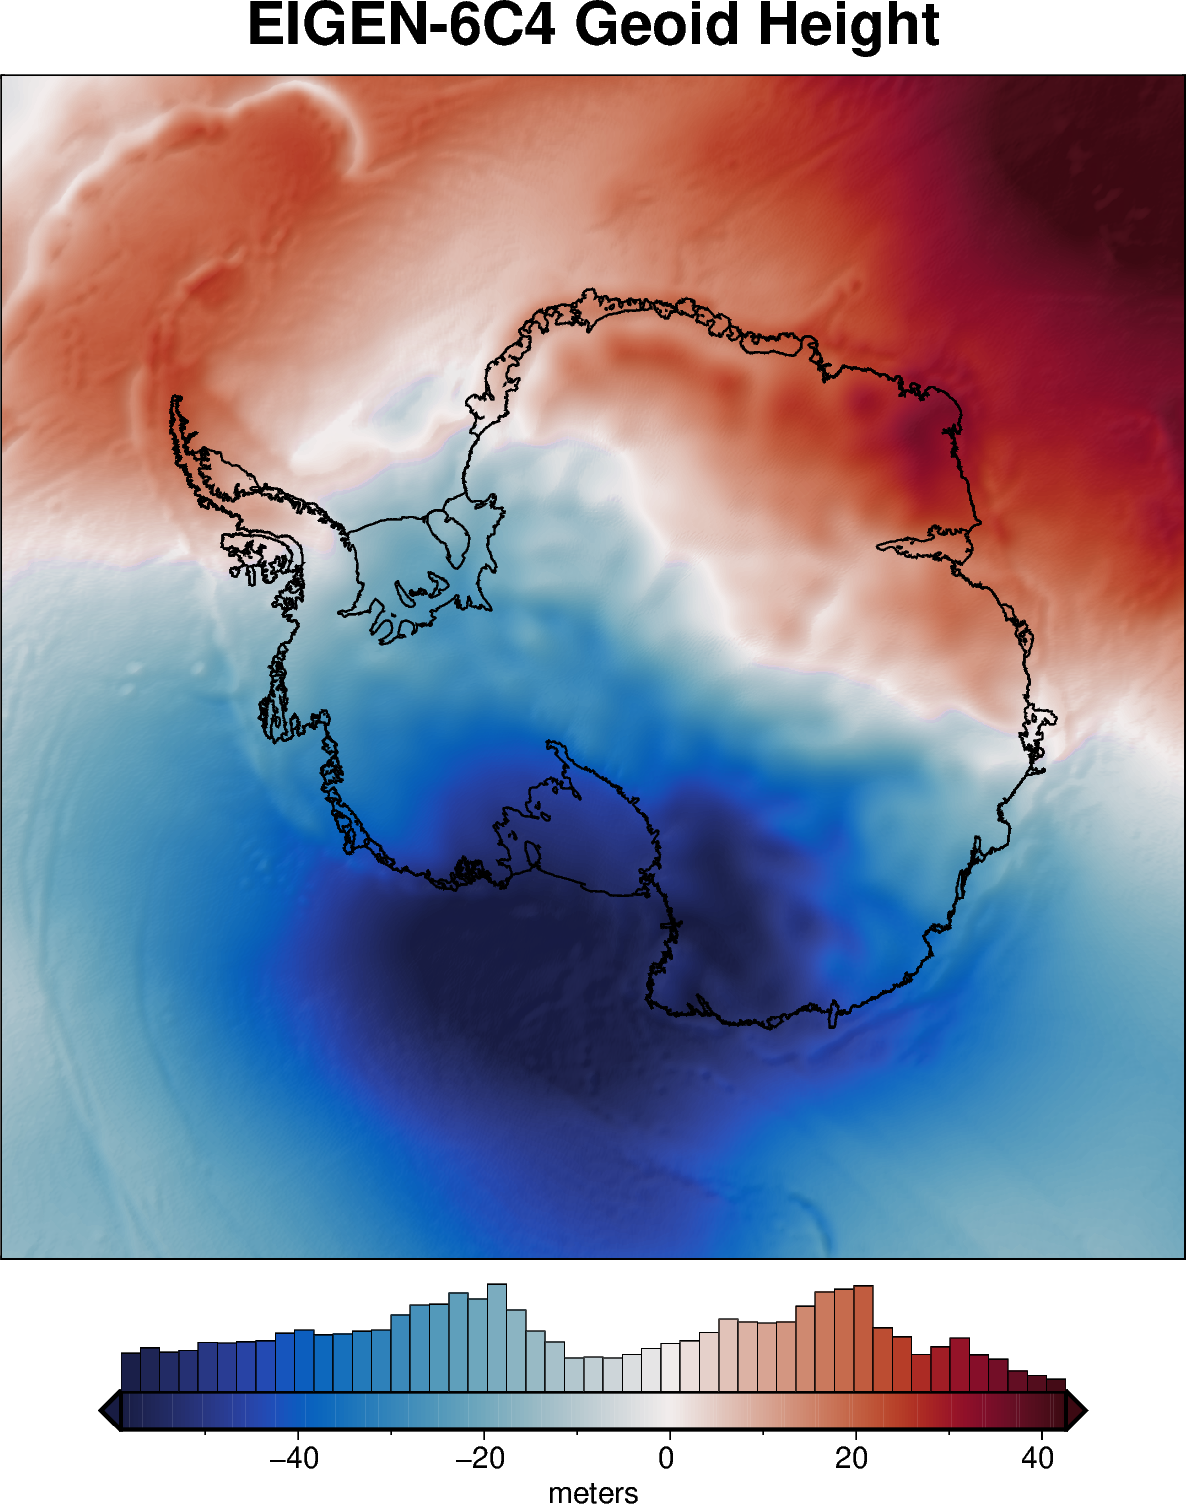
Description: Gridded geoid heights from EIGEN-6C4 originally at a 10 arc-min resolution. Can be added to a ellipsoid-referenced elevation grid to convert it to be referenced to the geoid.
Dataset:
Uieda, Leonardo. “Fatiando a Terra Data: Earth - Geoid Height Grid at 10 Arc-Minute Resolution.” Zenodo, January 20, 2022. https://doi.org/10.5281/zenodo.5882205.
Associated paper:
Förste, Christoph, Sean.L. Bruinsma, Oleg Abrikosov, Jean-Michel Lemoine, Jean Charles Marty, Frank Flechtner, G. Balmino, F. Barthelmes, and R. Biancale. “EIGEN-6C4 The Latest Combined Global Gravity Field Model Including GOCE Data up to Degree and Order 2190 of GFZ Potsdam and GRGS Toulouse.” Application/octet-stream,application/octet-stream,application/zip. GFZ Data Services, 2014. https://doi.org/10.5880/ICGEM.2015.1.
[1]:
%%capture
%load_ext autoreload
%autoreload 2

from polartoolkit import fetch, maps, utils
[2]:
data = fetch.geoid(
    hemisphere="south"
    # available options
    # region,
    # spacing,
    # registration ("g" for gridline or "p" for pixel),
)
data
100%|█████████████████████████████████████| 1.34M/1.34M [00:00<00:00, 1.17GB/s]
grdproject [WARNING]: x_inc does not divide 180; geographic boundary condition changed to natural.
grdsample [WARNING]: Output sampling interval in x exceeds input interval and may lead to aliasing.
grdsample [WARNING]: Output sampling interval in y exceeds input interval and may lead to aliasing.
[2]:
<xarray.DataArray 'z' (y: 1401, x: 1401)> Size: 8MB
array([[-15.447334 , -15.45749  , -15.470287 , ..., -19.354572 ,
        -19.402414 , -19.461971 ],
       [-15.473542 , -15.4770975, -15.484859 , ..., -19.373356 ,
        -19.422113 , -19.482586 ],
       [-15.513984 , -15.510603 , -15.508467 , ..., -19.397635 ,
        -19.451193 , -19.514528 ],
       ...,
       [ -3.0477617,  -3.0241063,  -3.0000122, ...,  46.07665  ,
         46.20535  ,  46.339397 ],
       [ -3.021701 ,  -2.9997349,  -2.9738908, ...,  46.052635 ,
         46.180782 ,  46.314655 ],
       [ -3.000257 ,  -2.9821365,  -2.956238 , ...,  46.023617 ,
         46.152454 ,  46.286663 ]], shape=(1401, 1401), dtype=float32)
Coordinates:
  * y        (y) float64 11kB -3.5e+06 -3.495e+06 ... 3.495e+06 3.5e+06
  * x        (x) float64 11kB -3.5e+06 -3.495e+06 ... 3.495e+06 3.5e+06
Attributes:
    Conventions:   CF-1.7
    title:
    history:       gmt grdsample @GMTAPI@-S-I-G-M-G-N-000000 -G@GMTAPI@-S-O-G...
    description:
    actual_range:  [-66.12410736  52.22008133]
long_name: z[3]:
_ = utils.get_grid_info(data, print_info=True)
grid spacing: 5000.0 m
grid region: (-3500000.0, 3500000.0, -3500000.0, 3500000.0)
grid zmin: -66.1241073608
grid zmax: 52.2200813293
grid registration: g
[4]:
fig = maps.plot_grd(
    data,
    title="EIGEN-6C4 Geoid Height",
    cmap="balance+h0",
    coast=True,
    cbar_label="meters",
    hist=True,
    robust=True,
    hemisphere="south",
    shading="+nt.1",
)

fig.show(dpi=200)
[ ]: