Glacial Isostatic Adjustment#
Description: Gridded estimates of glacial isostatic adjustment values.
Dataset:
Stål, Tobias, Anya M. Reading, Jacqueline A. Halpin, Phipps Steven J, and Joanne M. Whittaker. “The Antarctic Crust and Upper Mantle: A Flexible 3D Model and Framework for Interdisciplinary Research.” Zenodo, August 27, 2020. https://doi.org/10.5281/zenodo.4003423.
Associated paper:
Stål, Tobias, Anya M. Reading, Jacqueline A. Halpin, Steven J. Phipps, and Joanne M. Whittaker. “The Antarctic Crust and Upper Mantle: A Flexible 3D Model and Software Framework for Interdisciplinary Research.” Frontiers in Earth Science 8 (November 27, 2020): 577502. https://doi.org/10.3389/feart.2020.577502.
[1]:
%%capture
%load_ext autoreload
%autoreload 2

from polartoolkit import fetch, maps, utils
[2]:
data = fetch.gia(
    version="stal-2020",
    # available options
    # region,
    # spacing,
    # registration ("g" for gridline or "p" for pixel),
)
data
[2]:
<xarray.DataArray 'band_data' (y: 560, x: 560)> Size: 3MB
array([[nan, nan, nan, ..., nan, nan, nan],
       [nan, nan, nan, ..., nan, nan, nan],
       [nan, nan, nan, ..., nan, nan, nan],
       ...,
       [nan, nan, nan, ..., nan, nan, nan],
       [nan, nan, nan, ..., nan, nan, nan],
       [nan, nan, nan, ..., nan, nan, nan]], shape=(560, 560))
Coordinates:
  * x        (x) float64 4kB -2.795e+06 -2.785e+06 ... 2.785e+06 2.795e+06
  * y        (y) float64 4kB -2.795e+06 -2.785e+06 ... 2.785e+06 2.795e+06
Attributes:
AREA_OR_POINT: Area[3]:
_ = utils.get_grid_info(data, print_info=True)
grid spacing: 10000.0 m
grid region: (-2800000.0, 2800000.0, -2800000.0, 2800000.0)
grid zmin: -2953.8605957
grid zmax: 3931.43554688
grid registration: p
[4]:
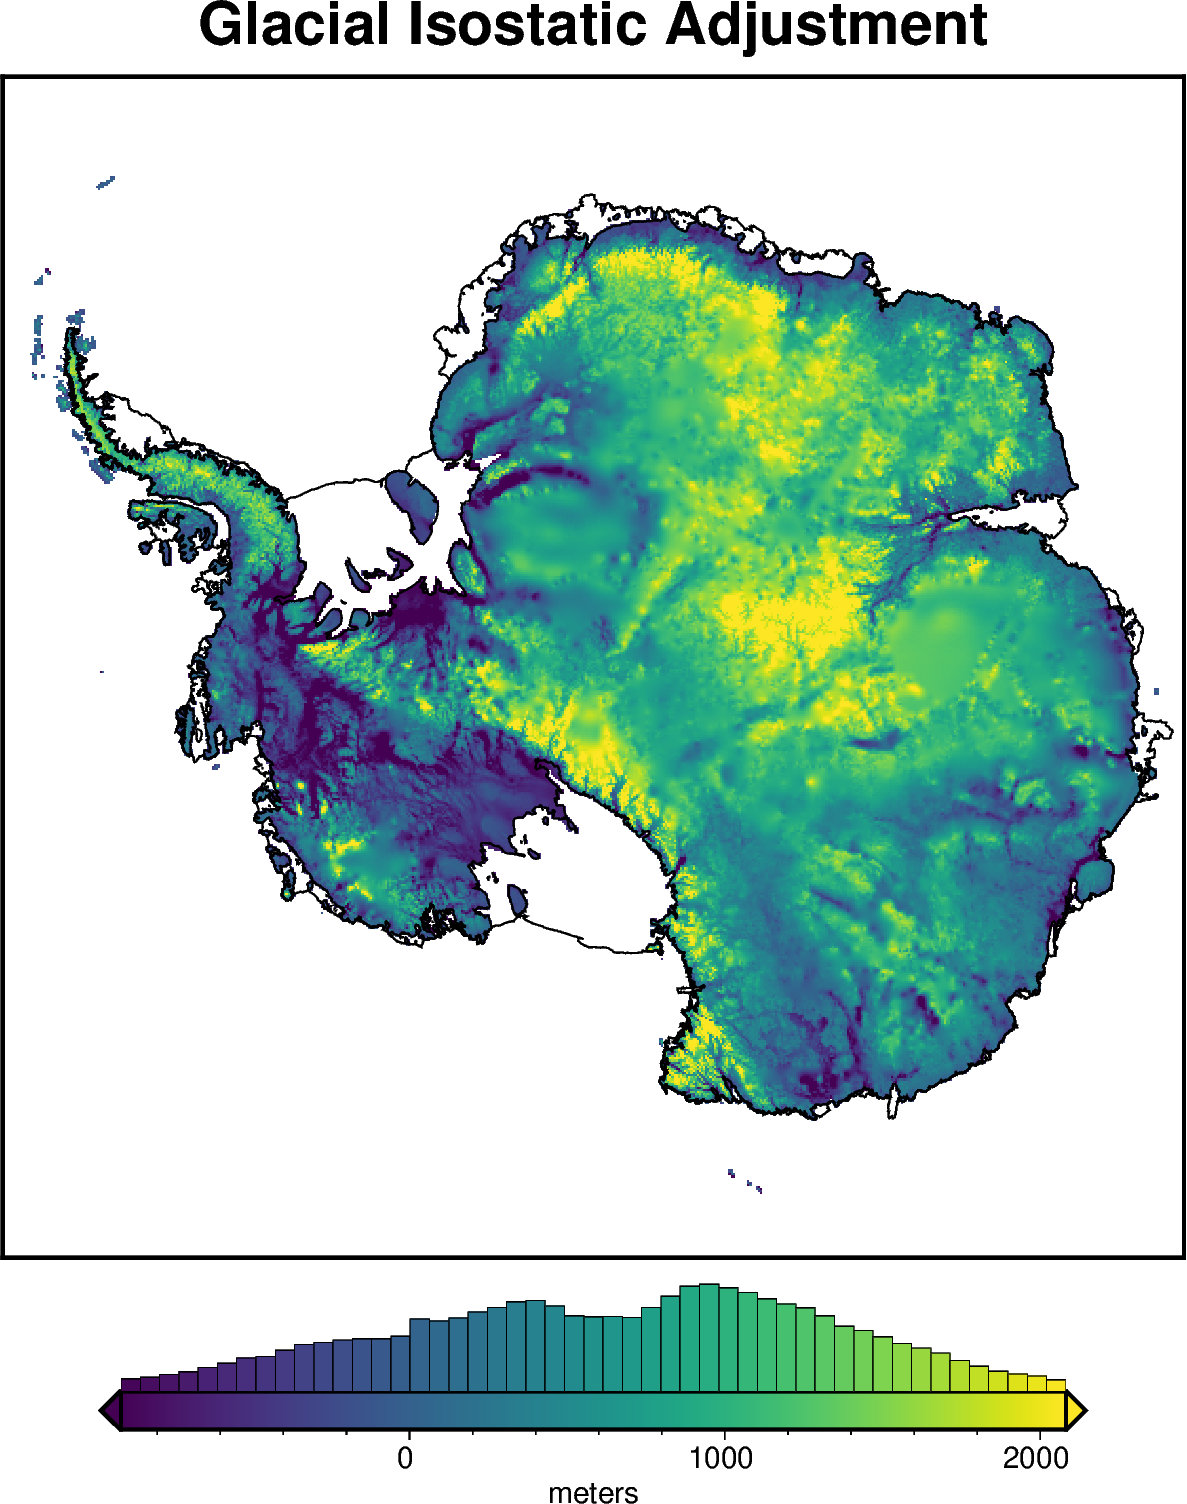
fig = maps.plot_grd(
    data,
    title="Glacial Isostatic Adjustment",
    coast=True,
    cbar_label="meters",
    hist=True,
    robust=True,
    hemisphere="south",
)

fig.show(dpi=200)
[ ]: