4. Add map features#
Here we will showcase the various embellishments you can easily add to your maps.
Import the modules
[1]:
from polartoolkit import fetch, maps, regions
Some of the features we will add require PolarToolkit to know when hemisphere we are working in, an easy way to tell PolarToolkit this is to set a Python environment variable.
[2]:
import os

os.environ["POLARTOOLKIT_HEMISPHERE"] = "south"
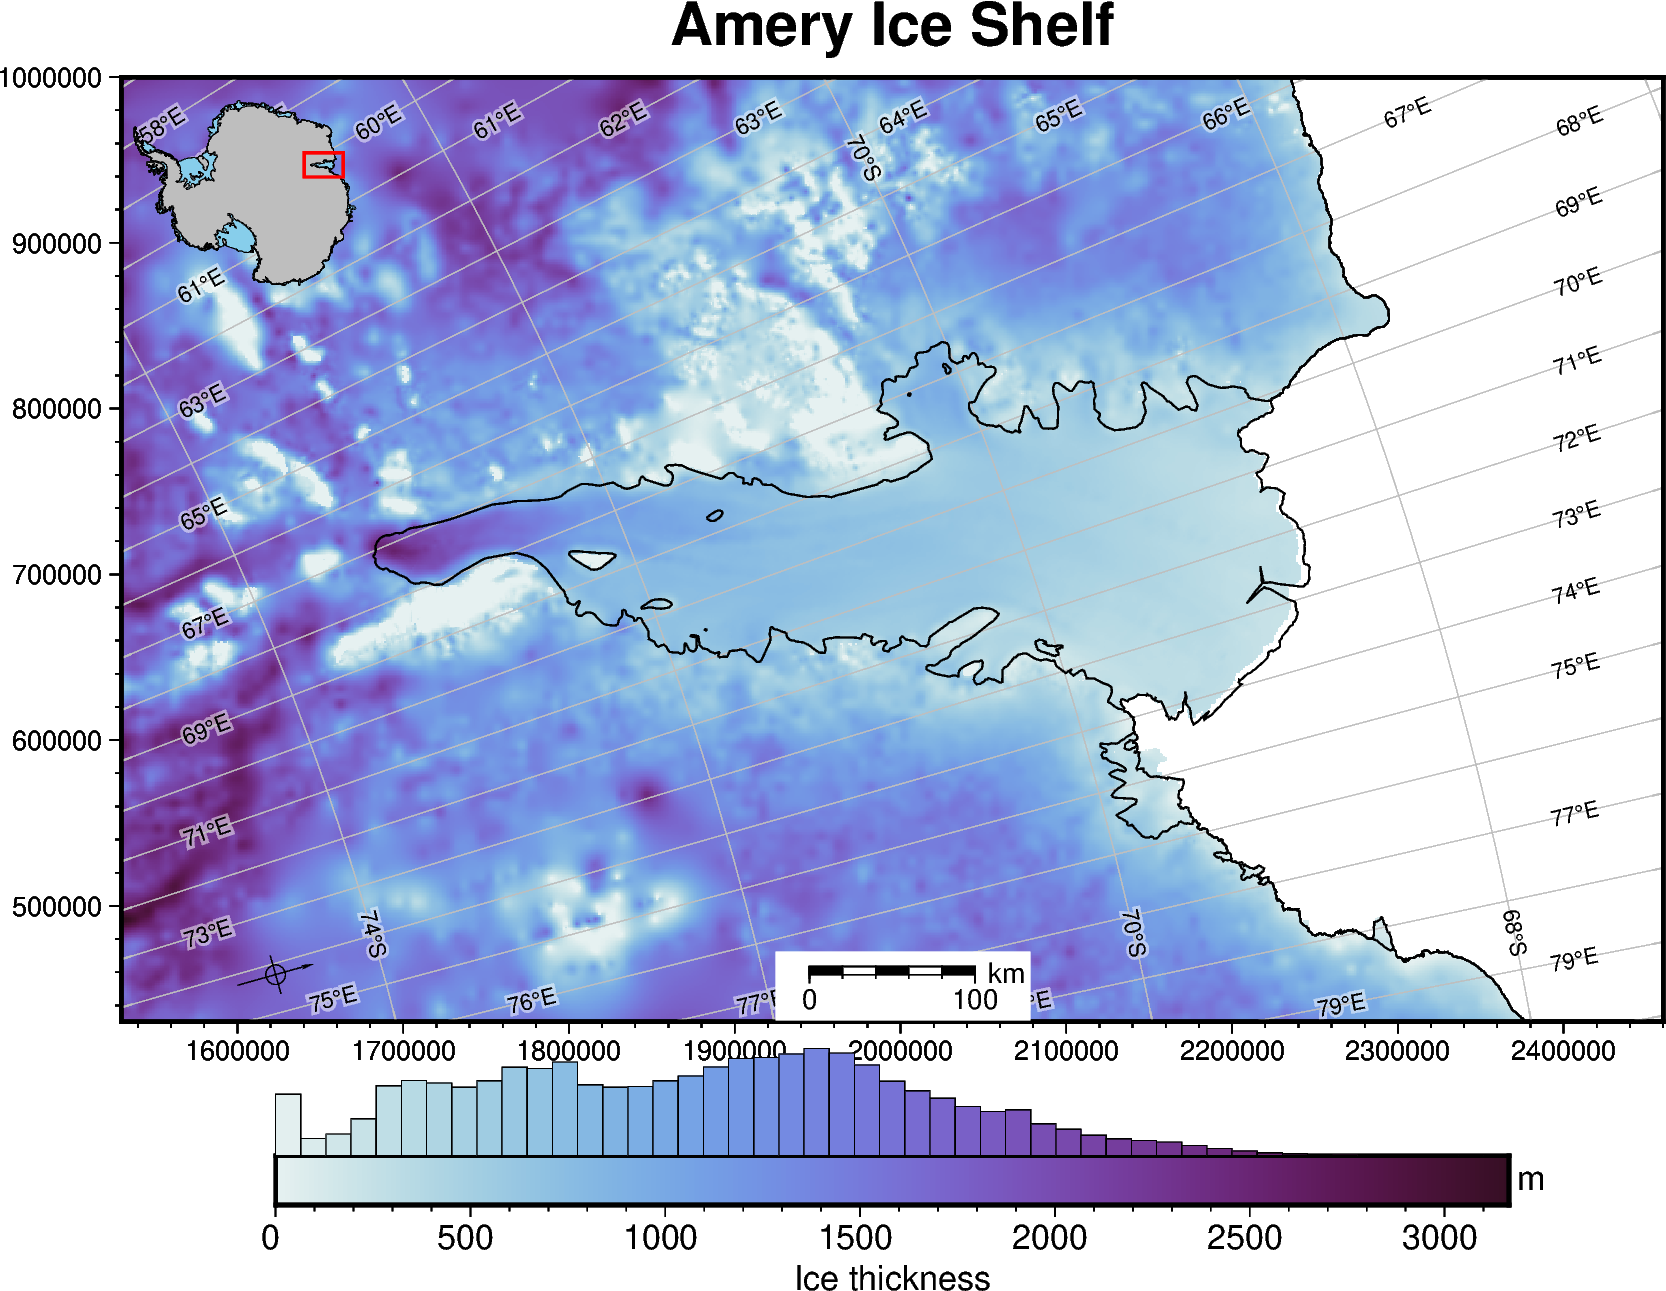
Use the PolarToolkit fetch module to download some Antarctic ice thickness data for the Amery Ice Shelf and return the grid as an xarray.DataArray
[3]:
ice_thickness = fetch.bedmap2(
    layer="ice_thickness",
    region=regions.amery_ice_shelf,
)
[4]:
fig = maps.plot_grd(
    ice_thickness,
    fig_height=12,  # set figure height
    title="Amery Ice Shelf",
    cbar_label="Ice thickness",  # add label to colorbar
    cbar_unit="m",  # add units to y-axis of colorbar
    cmap="dense",  # set the colormap
    hist=True,  # add a histogram to the colorbar
    coast=True,  # plot grounding and coastlines
    inset=True,  #  add inset map showing figure's location
    scalebar=True,  # add scalebar
    gridlines=True,  # add lat/lon gridlines
    north_arrow=True,  # add a north arrow
    frame=True,  # add a frame around the figure
)

# display the figure
fig.show(dpi=200)
gmtset [WARNING]: Representation of font type not recognized. Using default.
For more options and detail of features for maps, see this how-to guide.