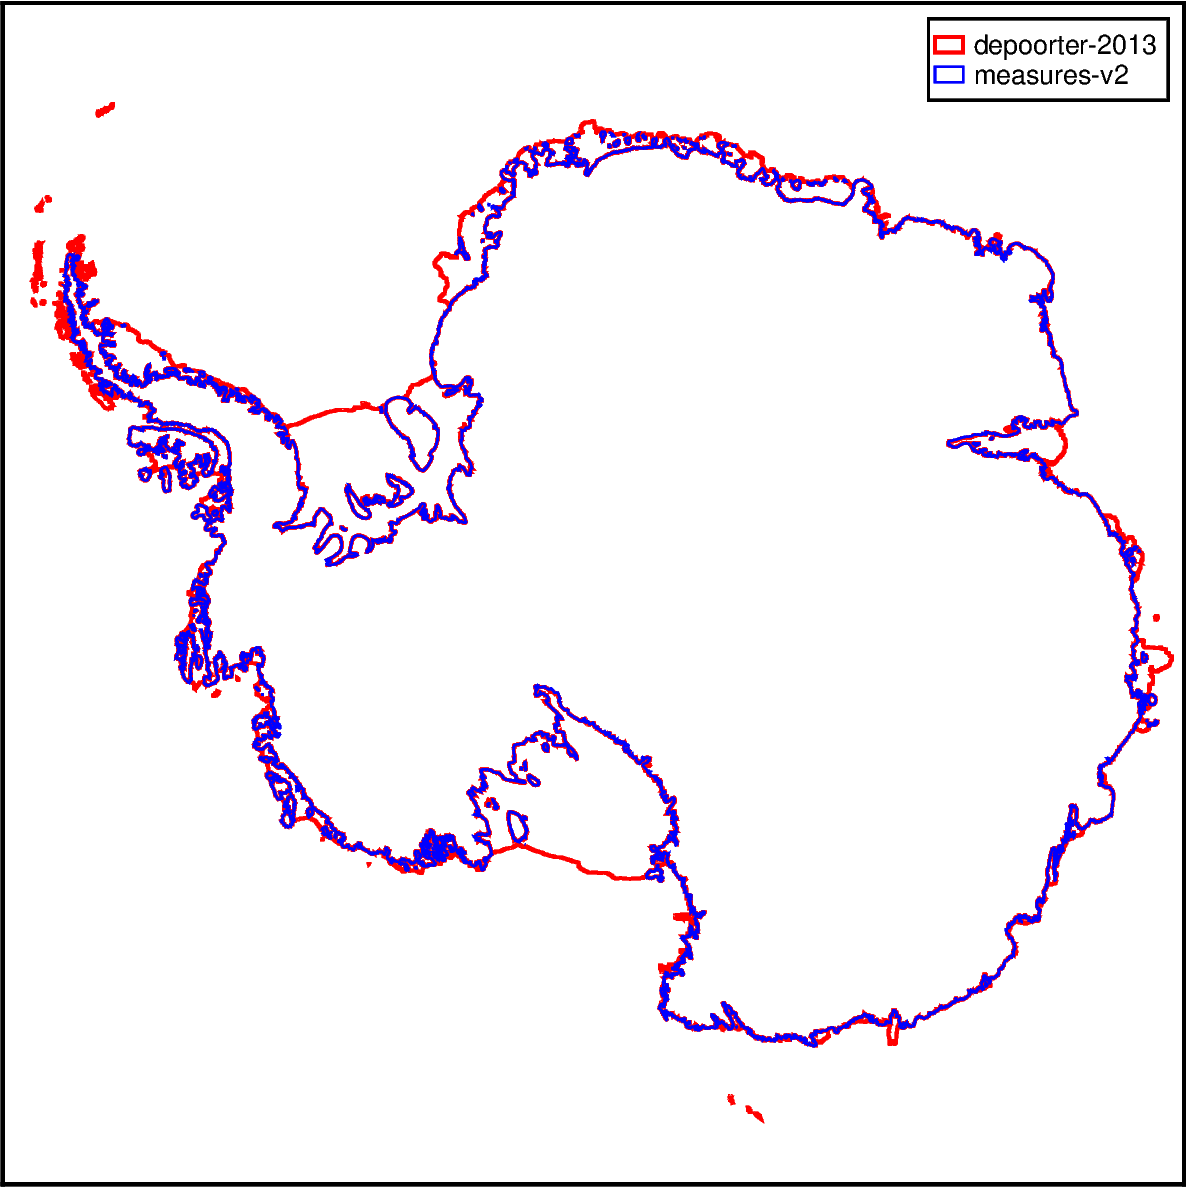
Groundingline locations#
Description: The locations of the groundingline and coastline for Antarctica from various sources.
The version from MEaSUREs requires an EarthData login, see link for how to configure this.
Dataset:
Depoorter, Mathieu A., Jonathan L. Bamber, Jennifer Griggs, Jan T. M. Lenaerts, Stefan R. M. Ligtenberg, Michiel R. van den Broeke, and Geir Moholdt. “Antarctic Masks (Ice-Shelves, Ice-Sheet, and Islands), Link to Shape File.” In Supplement to: Depoorter, MA et al. (2013): Calving Fluxes and Basal Melt Rates of Antarctic Ice Shelves. Nature, 502, 89-92, Https://Doi.Org/10.1038/Nature12567. PANGAEA, 2013. https://doi.org/10.1594/PANGAEA.819147.
Mouginot, J., B. Scheuchl, and E. Rignot. “MEaSUREs Antarctic Boundaries for IPY 2007-2009 from Satellite Radar, Version 2.” National Snow and Ice Data Center, 2017. https://nsidc.org/data/nsidc-0709/versions/2.
Associated paper:
Depoorter, M. A., J. L. Bamber, J. A. Griggs, J. T. M. Lenaerts, S. R. M. Ligtenberg, M. R. van den Broeke, and G. Moholdt. “Calving Fluxes and Basal Melt Rates of Antarctic Ice Shelves.” Nature 502, no. 7469 (2013): 89–92. https://doi.org/10.1038/nature12567.
[1]:
%%capture
%load_ext autoreload
%autoreload 2

from polartoolkit import fetch, maps, regions
[2]:
version_names = [
    "depoorter-2013",
    "measures-v2",
]

filepaths = []
for name in version_names:
    filepaths.append(
        fetch.groundingline(
            version=name,
        )
    )
[3]:
fig = maps.basemap(
    region=regions.antarctica,
    hemisphere="south",
)

# plot the shapefiles
pens = ["1.2p,red", ".8p,blue"]
for i, v in enumerate(version_names):
    fig.plot(filepaths[i], pen=pens[i], label=v)

# add a legend
fig.legend()

fig.show(dpi=200)
[ ]: