Crustal Thickness Grids#
Description: Crustal thickness grids and point measurements from various sources.
Associated papers:
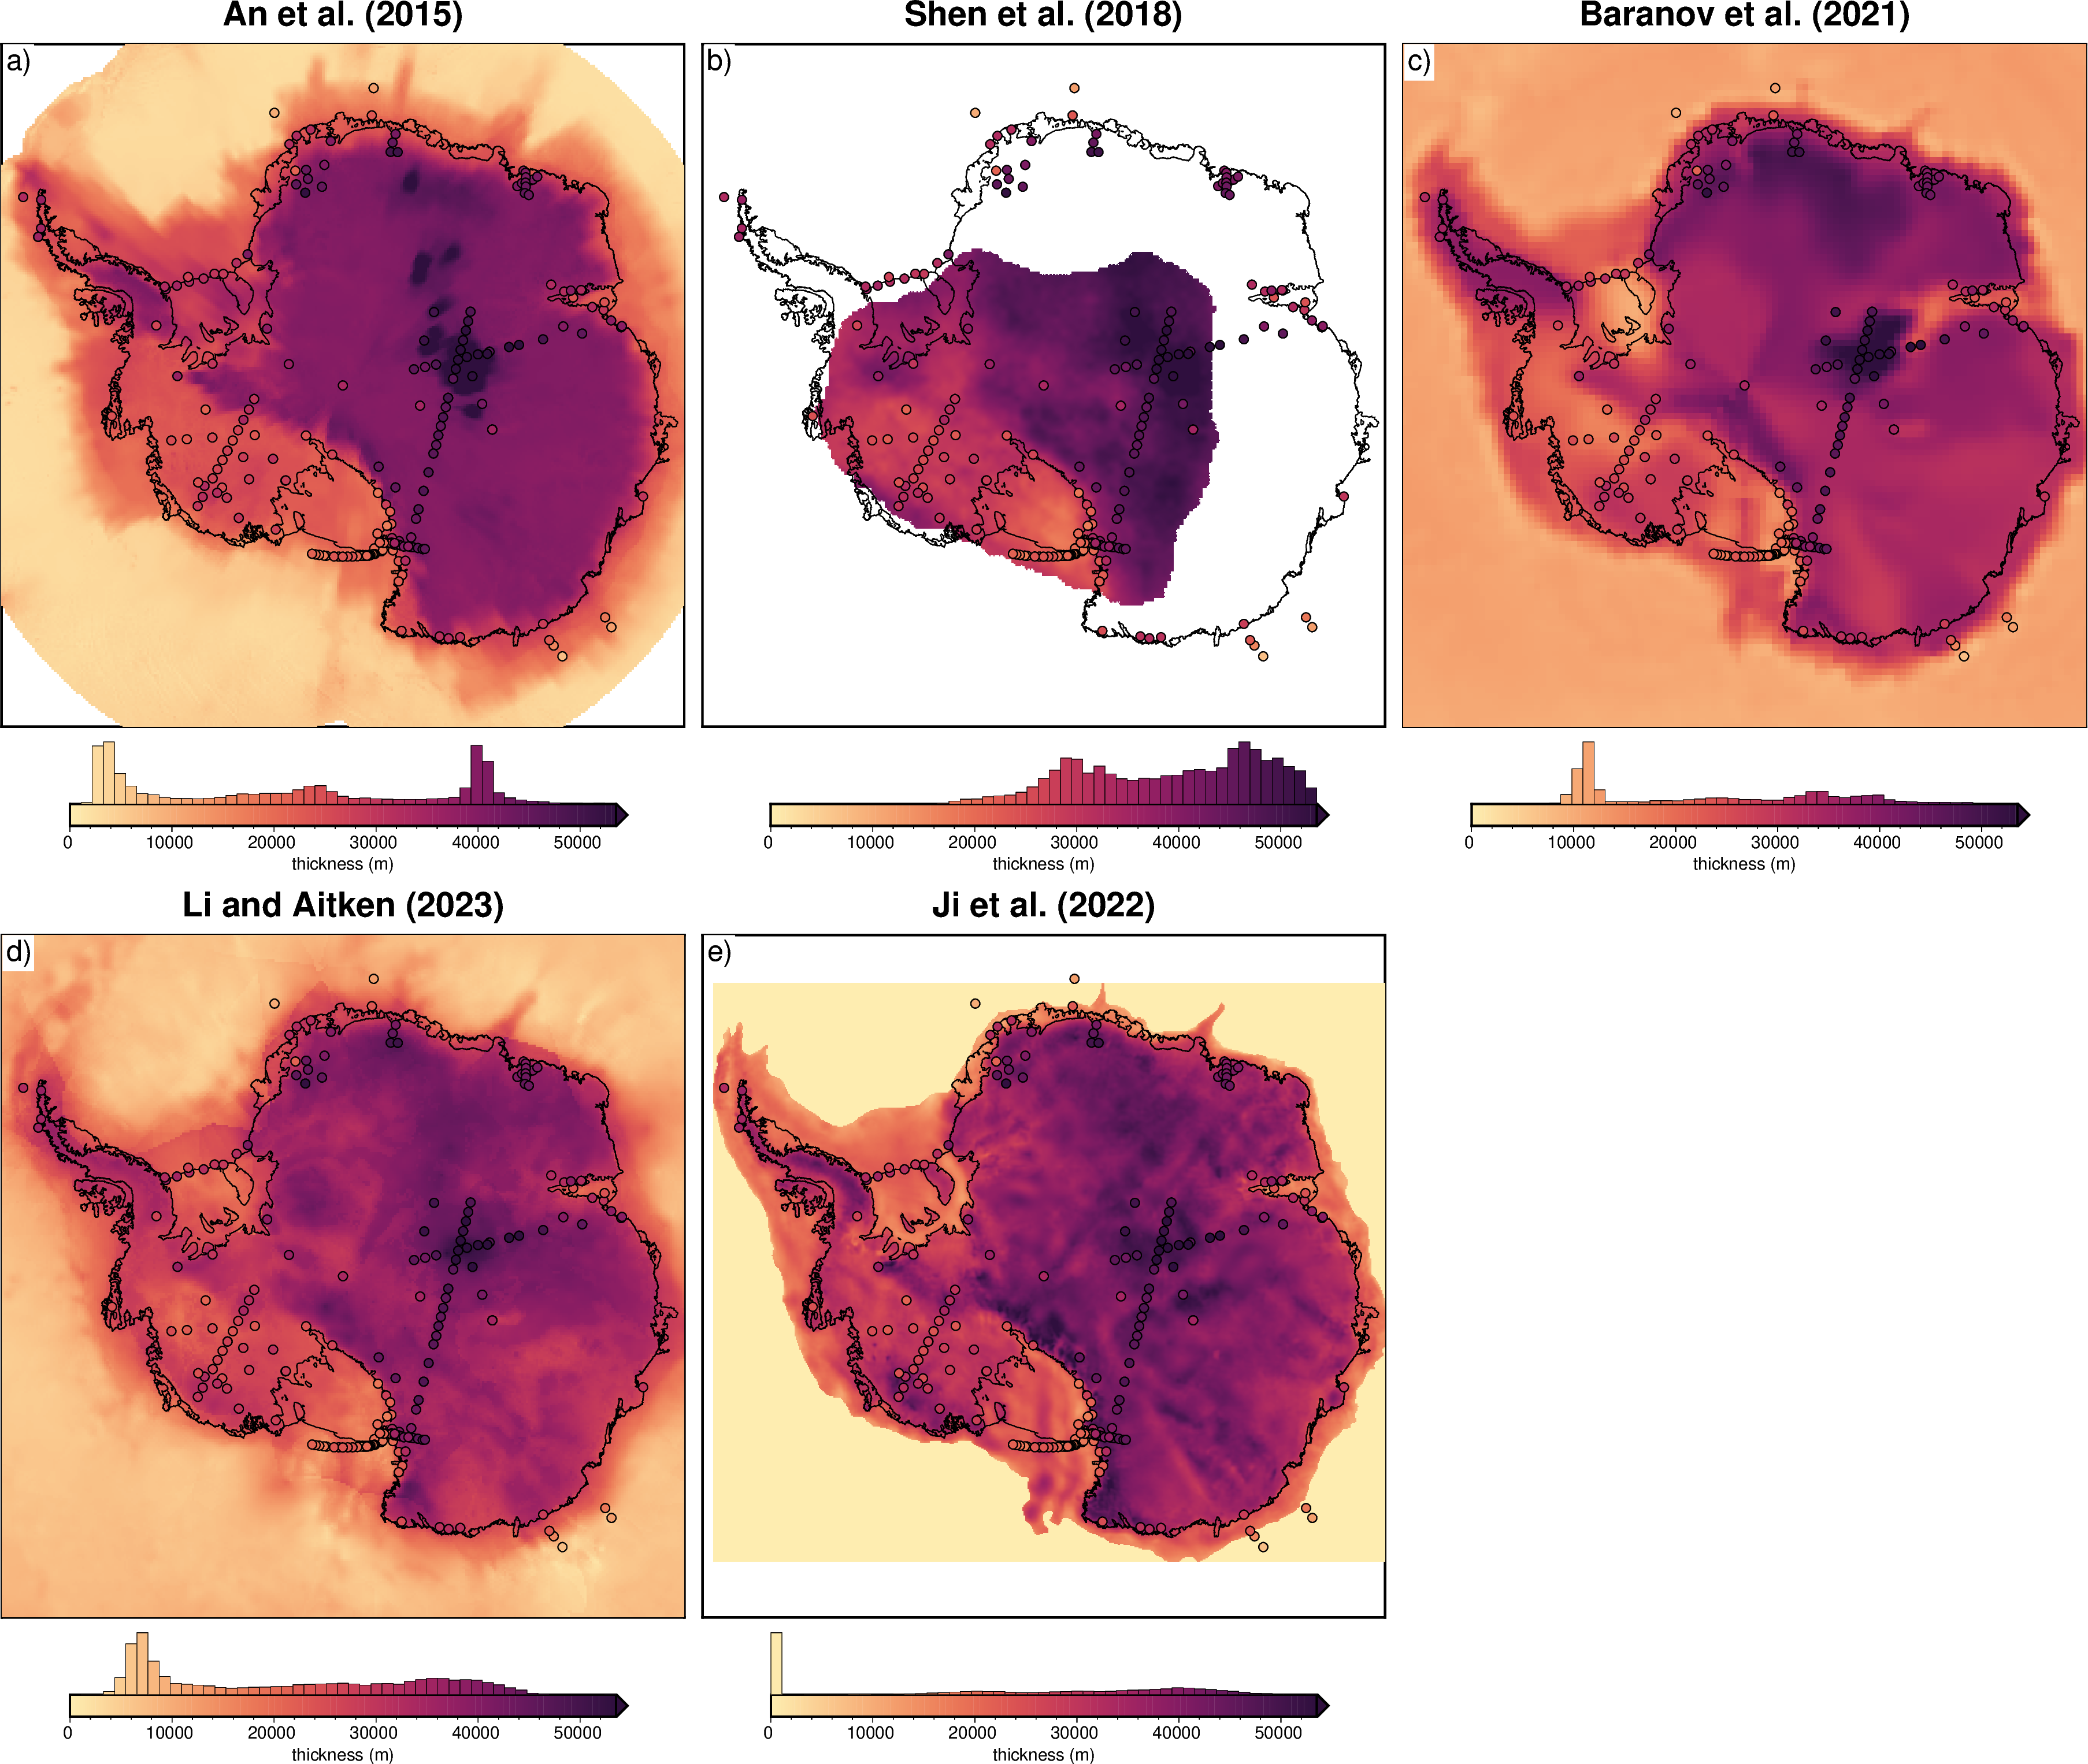
Shen, Weisen, Douglas A. Wiens, Sridhar Anandakrishnan, Richard C. Aster, Peter Gerstoft, Peter D. Bromirski, Samantha E. Hansen, et al. “The Crust and Upper Mantle Structure of Central and West Antarctica from Bayesian Inversion of Rayleigh Wave and Receiver Functions.” Journal of Geophysical Research: Solid Earth 123, no. 9 (2018): 7824–49. https://doi.org/10.1029/2017JB015346.
An, Meijian, Douglas A. Wiens, Yue Zhao, Mei Feng, Andrew A. Nyblade, Masaki Kanao, Yuansheng Li, Alessia Maggi, and Jean-Jacques Lévêque. “S-Velocity Model and Inferred Moho Topography beneath the Antarctic Plate from Rayleigh Waves: Antarctic S-Velocities and Moho.” Journal of Geophysical Research: Solid Earth 120, no. 1 (2015): 359–83. https://doi.org/10.1002/2014JB011332.
Baranov, A., R. Tenzer, and A. Morelli. 2021. “Updated Antarctic Crustal Model.” Gondwana Research 89 (January): 1–18. https://doi.org/10.1016/j.gr.2020.08.010.
Li, L., and A. R. A. Aitken. 2024. “Crustal Heterogeneity of Antarctica Signals Spatially Variable Radiogenic Heat Production.” Geophysical Research Letters 51 (2): e2023GL106201. https://doi.org/10.1029/2023GL106201.
Ji, Fei, Leyuan Wu, and Qiao Zhang. 2022. “Gravity-Derived Antarctic Crustal Thickness Based on the Gauss-FFT Method.” Geochemistry, Geophysics, Geosystems 23 (8): e2022GC010555. https://doi.org/10.1029/2022GC010555.
[1]:
import polartoolkit as ptk
[2]:
version_names = [
    "an-2015",
    "shen-2018",
    "baranov-2021",
    "li-2023",  # gives a dataset with `thickness` and `uncertainty` variables
    "ji-2022",
]

grids = []
for name in version_names:
    data = ptk.fetch.crustal_thickness(
        version=name,
        # available options
        # region,
        # spacing,
        # registration ("g" for gridline or "p" for pixel),
    )
    if name == "li-2023":
        data = data["thickness"]
    grids.append(data)
    print(f"Info for {name}")
    _ = ptk.get_grid_info(data, print_info=True)
    print("##########")
Info for an-2015
grid spacing: 20000.0 m
grid region: (-3300000.0, 3300000.0, -3300000.0, 3300000.0)
grid zmin: 1218.99853516
grid zmax: 66076.578125
grid registration: g
##########
Info for shen-2018
grid spacing: 10000.0 m
grid region: (-2800000.0, 2800000.0, -2800000.0, 2800000.0)
grid zmin: 17218.0996094
grid zmax: 57223.5273438
grid registration: g
##########
Info for baranov-2021
grid spacing: 50000.0 m
grid region: (-3300000.0, 3300000.0, -3300000.0, 3300000.0)
grid zmin: 6956.75439453
grid zmax: 59125.9101562
grid registration: g
##########
Info for li-2023
grid spacing: 20000.0 m
grid region: (-3340000.0, 3340000.0, -3340000.0, 3340000.0)
grid zmin: 863.798950195
grid zmax: 58056.1054688
grid registration: p
##########
Info for ji-2022
grid spacing: 10000.0 m
grid region: (-2710000.0, 2930000.0, -2340000.0, 2400000.0)
grid zmin: 0.0
grid zmax: 58622.640625
grid registration: g
##########
[3]:
an_2015_points = ptk.fetch.crustal_thickness(
    version="an-2015-points",
)
an_2015_points
[3]:
| Name | lon | lat | crustal_thickness | moho_elevation | Sources | x | y | |
|---|---|---|---|---|---|---|---|---|
| 0 | 9169 | -6.0200 | -75.0000 | 45000.0 | -42300.0 | 1 | -1.718684e+05 | 1.629746e+06 |
| 1 | 9172 | -9.7000 | -73.6000 | 44000.0 | -42600.0 | 1 | -3.022151e+05 | 1.768031e+06 |
| 2 | 96100B | 5.9000 | -67.7000 | 12000.0 | -16000.0 | 2 | 2.521265e+05 | 2.439778e+06 |
| 3 | 96100E | 6.1000 | -69.7000 | 23000.0 | -25000.0 | 2 | 2.367647e+05 | 2.215463e+06 |
| 4 | 96110B | -14.1000 | -69.0000 | 10000.0 | -14000.0 | 2 | -5.619126e+05 | 2.237068e+06 |
| ... | ... | ... | ... | ... | ... | ... | ... | ... |
| 201 | WRS-6 | 170.7730 | -77.0716 | 18200.0 | -19000.0 | 19 | 2.261608e+05 | -1.392202e+06 |
| 202 | WRS-7 | 171.1800 | -77.0539 | 19200.0 | -20000.0 | 19 | 2.165642e+05 | -1.395697e+06 |
| 203 | WRS-8 | 171.5800 | -77.0551 | 20300.0 | -21000.0 | 19 | 2.067959e+05 | -1.397044e+06 |
| 204 | WRS-9 | 171.9880 | -77.0641 | 20300.0 | -21000.0 | 19 | 1.967045e+05 | -1.397501e+06 |
| 205 | ZHSH | 76.3727 | -69.3747 | 38300.0 | -38300.0 | 13 | 2.200780e+06 | 5.335348e+05 |
206 rows × 8 columns
[4]:
cpt_lims = ptk.get_combined_min_max(grids, robust=True)

fig = ptk.subplots(
    grids=grids,
    region=ptk.regions.antarctica,
    titles=[
        "An et al. (2015)",
        "Shen et al. (2018)",
        "Baranov et al. (2021)",
        "Li and Aitken (2023)",
        "Ji et al. (2022)",
    ],
    cmap="matter",
    cpt_lims=cpt_lims,
    cbar_label="thickness (m)",
    hist=True,
    hemisphere="south",
    coast=True,
    points=an_2015_points,
    points_fill="crustal_thickness",
    points_pen=".6p,black",
)
fig.show(dpi=200)