6. 3D plots#
PolarToolkit also supports some 3D plotting. Here we will download a dataset and make a simple 3D perspective plot.
[1]:
import polartoolkit as ptk
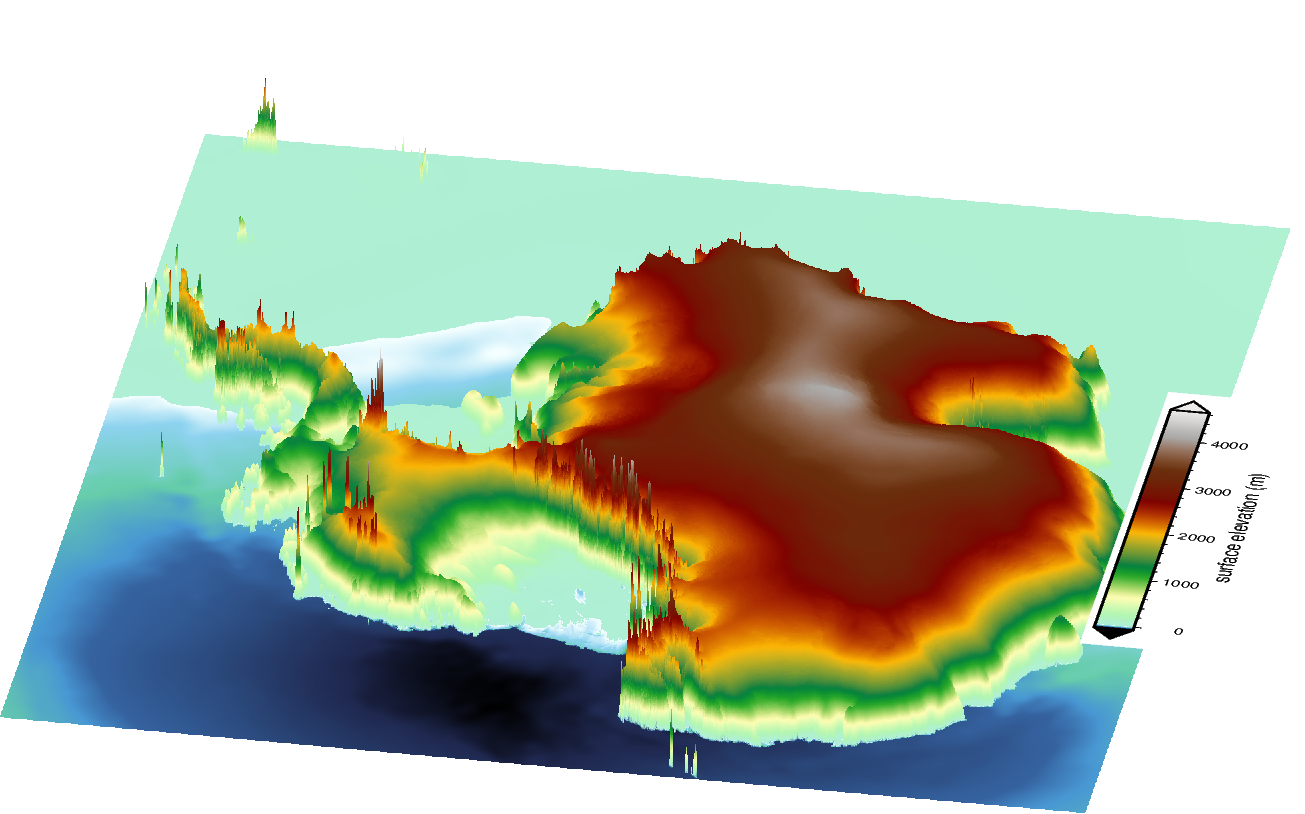
Download a grid of Antarctic surface elevation data from REMA
[2]:
surface = ptk.fetch.rema()
Use the plot_3d function to make a perspective image.
[3]:
fig = ptk.plot_3d(
    grids=surface,
    cmaps="earth",
    exaggeration=2,
    cbar_labels="surface elevation (m)",
    epsg="3031",
)
fig.show(dpi=200)
For further functionality of 3D plotting, see this how-to guide