3. Create a simple map#
Here we will showcase creating two very simple maps. All of the plotting functions in PolarToolkit use the python package PyGMT, which is a python wrapper on the widely-used GMT (Generic-Mapping-Tools).
Import the modules
[1]:
import polartoolkit as ptk
Inform polartoolkit that we want to make maps for Antarctica instead of the Arctic/Greenland by setting the environment variable POLARTOOLKIT_EPSG to the Antarctica Polar Stereographic projection EPSG 3031.
[2]:
import os

os.environ["POLARTOOLKIT_EPSG"] = "3031"
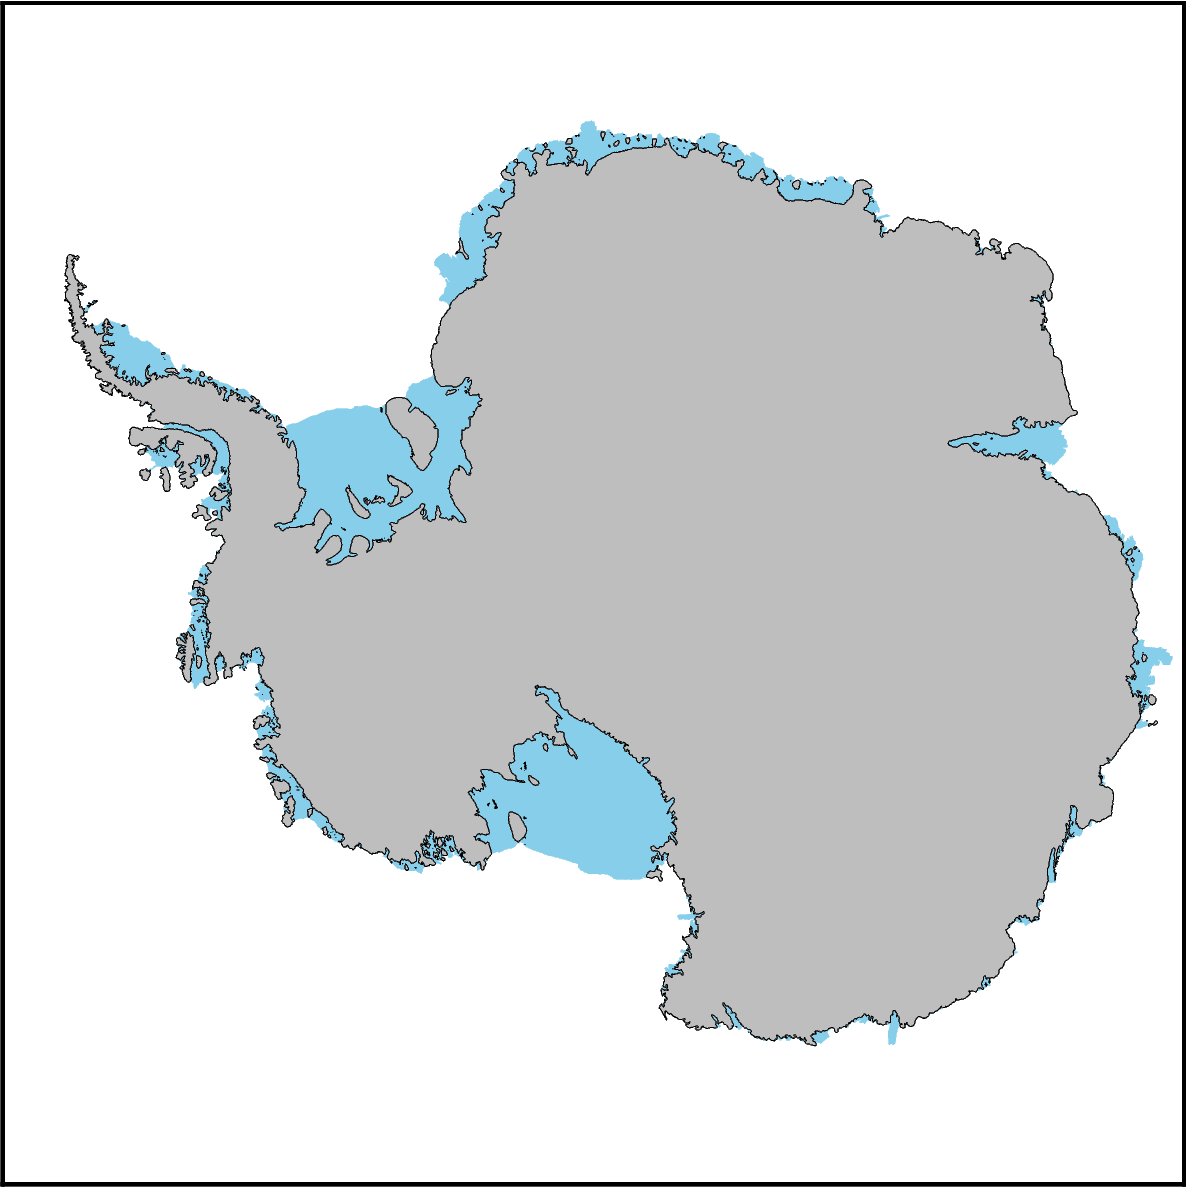
3.1. Map 1:#
Make a simple figure with a basemap showing grounding ice and floating ice. To see other types of basemaps we offer, see the how-to guide basemaps
[3]:
fig = ptk.basemap(
    simple_basemap=True,
    region=ptk.regions.antarctica,
)
fig.show(dpi=200)
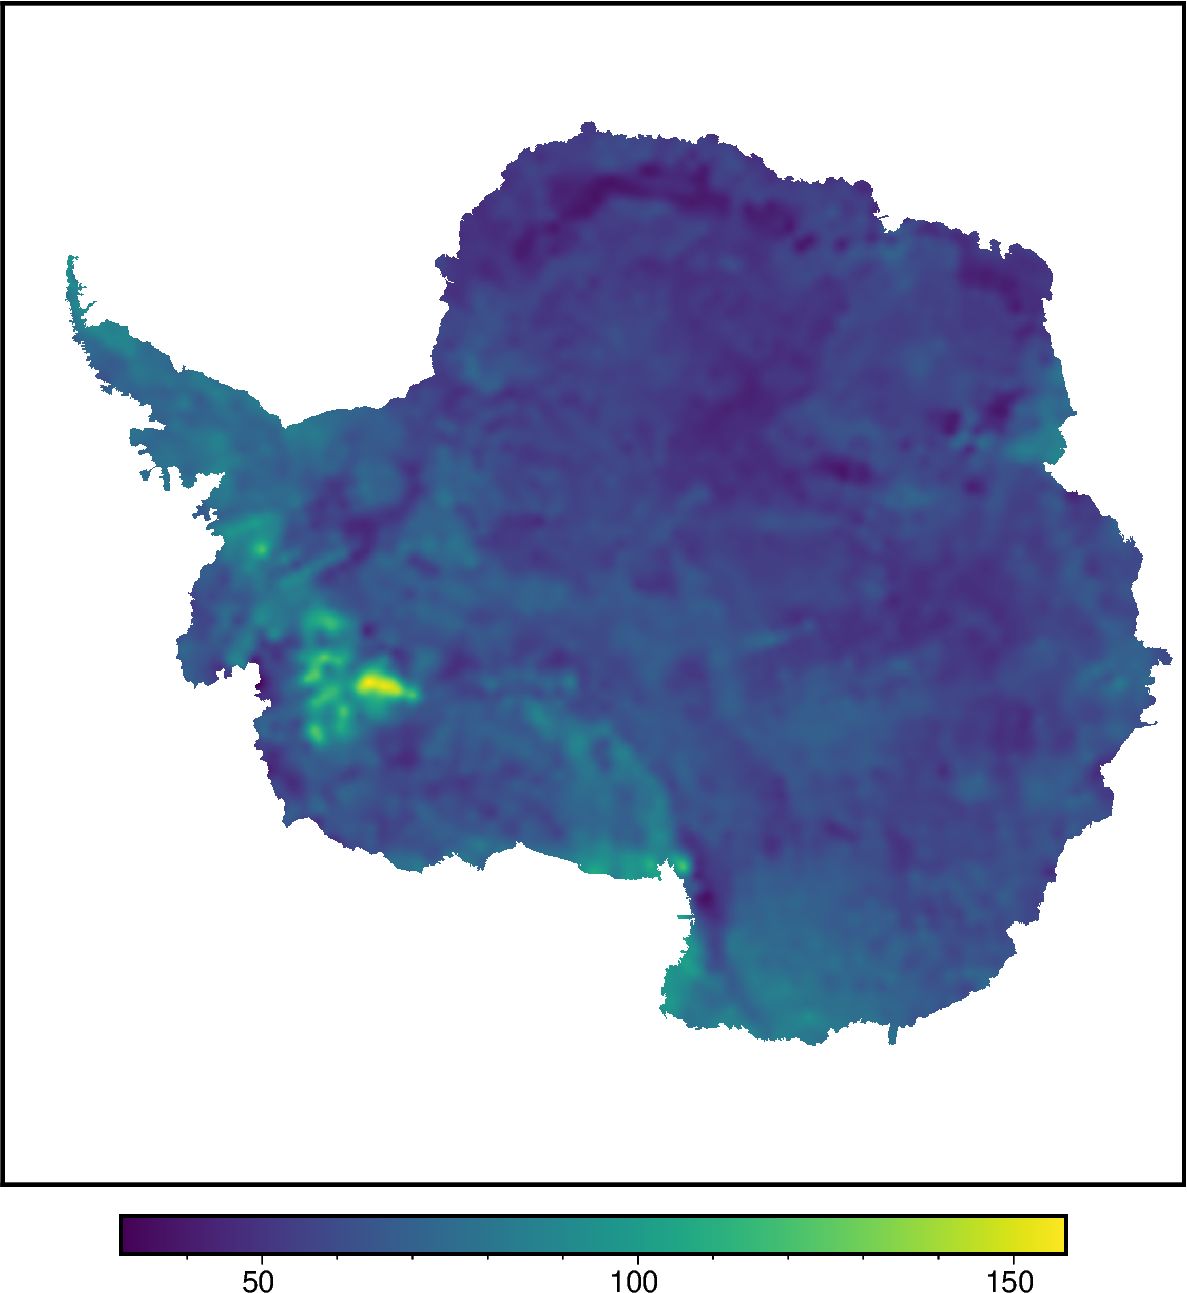
3.2. Map 2:#
Use the PolarToolkit fetch module to download some Antarctic geothermal heat flux data and return the grid as an xarray.DataArray
[4]:
grid = ptk.fetch.ghf(
    version="losing-ebbing-2021",
)
Create a simple map with default settings
[5]:
fig = ptk.plot_grid(grid)

fig.show(dpi=200)
The next tutorial will show a series of the embellishments you can add to the map.