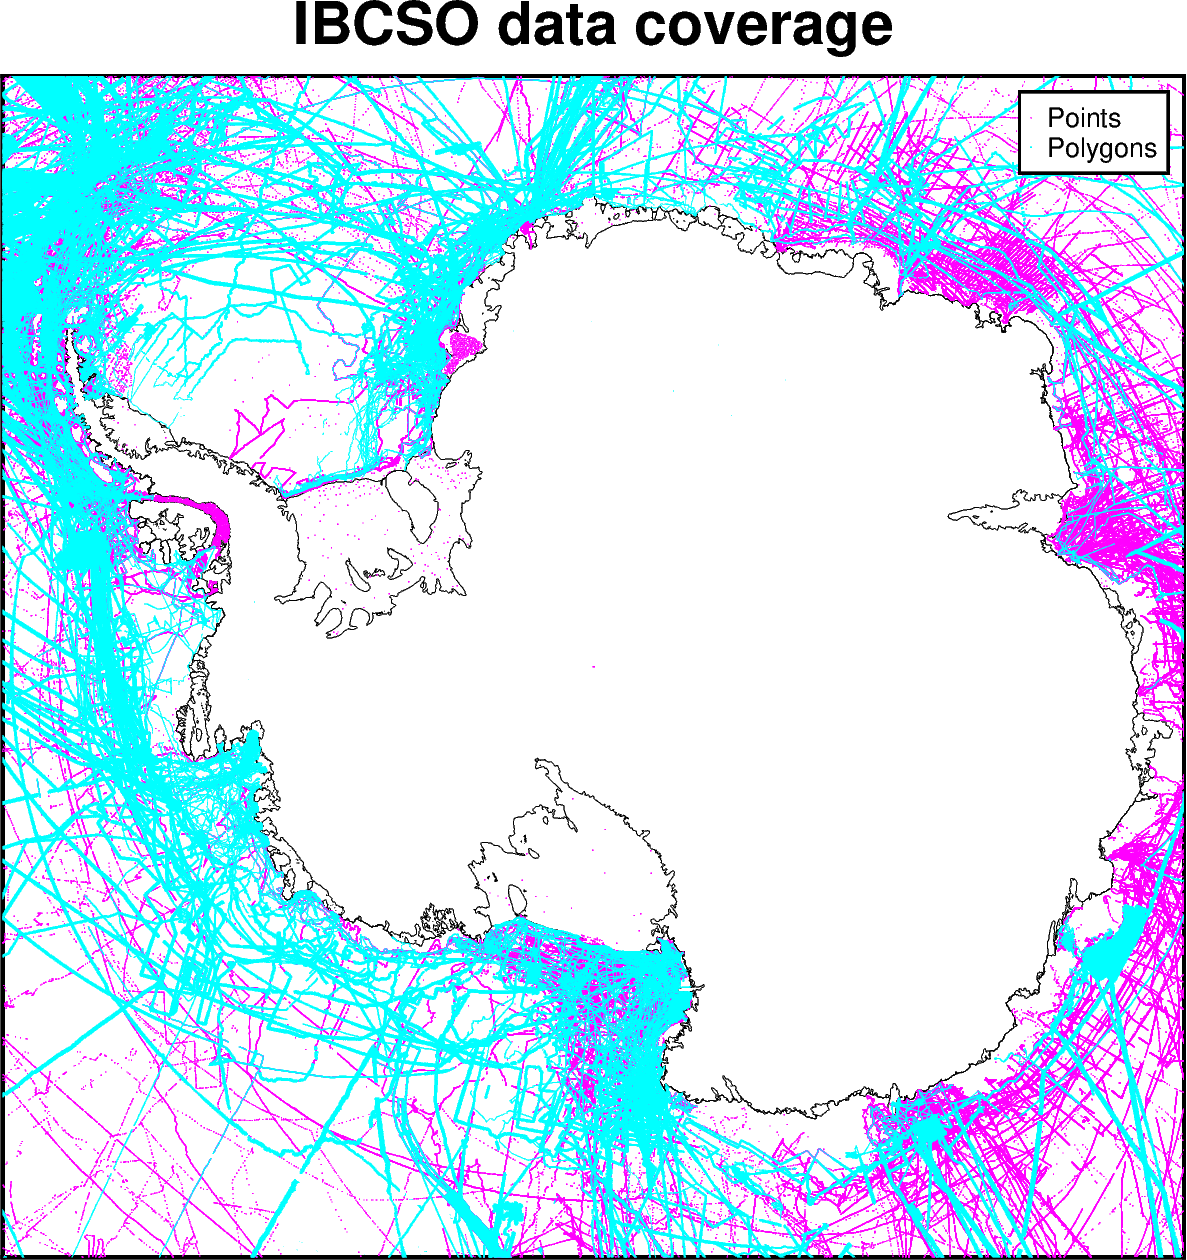
IBCSO v2 data coverage#
Description: International Bathymetric Chart of the Southern Ocean Version 2 data coverage.
Dataset:
Dorschel, Boris, Laura Hehemann, Sacha Viquerat, Fynn Warnke, Simon Dreutter, Yvonne Schulze Tenberge, Daniela Accettella, et al. “The International Bathymetric Chart of the Southern Ocean Version 2 (IBCSO V2).” PANGAEA, 2022. https://doi.org/10.1594/PANGAEA.937574.
Associated paper:
Dorschel, Boris, Laura Hehemann, Sacha Viquerat, Fynn Warnke, Simon Dreutter, Yvonne Schulze Tenberge, Daniela Accettella, et al. “The International Bathymetric Chart of the Southern Ocean Version 2.” Scientific Data 9, no. 1 (December 2022): 275. https://doi.org/10.1038/s41597-022-01366-7.
[1]:
import polartoolkit as ptk
[2]:
points_gdf, polygons_gdf = ptk.fetch.ibcso_coverage(
    # available options
    region=ptk.regions.antarctica,
)
[3]:
points_gdf.head()
[3]:
| dataset_name | dataset_tid | weight | geometry | easting | northing | |
|---|---|---|---|---|---|---|
| 103 | NBP95_1.xyz | 10 | 10 | POINT (196516.917 -2796367.56) | 196516.917232 | -2.796368e+06 |
| 103 | NBP95_1.xyz | 10 | 10 | POINT (196481.198 -2796007.306) | 196481.198017 | -2.796007e+06 |
| 103 | NBP95_1.xyz | 10 | 10 | POINT (195407.58 -2785946.734) | 195407.580459 | -2.785947e+06 |
| 103 | NBP95_1.xyz | 10 | 10 | POINT (195363.697 -2785590.562) | 195363.696851 | -2.785591e+06 |
| 103 | NBP95_1.xyz | 10 | 10 | POINT (195322.875 -2785222.144) | 195322.874891 | -2.785222e+06 |
[4]:
polygons_gdf.head()
[4]:
| dataset_name | dataset_tid | weight | geometry | |
|---|---|---|---|---|
| 718 | NBP9909.xyz | 11 | 20 | POLYGON ((-7122.412 -2488059.704, -6561.11 -24... |
| 847 | NBP0305A.xyz | 11 | 25 | POLYGON ((141581.785 -2793491.652, 141616.483 ... |
| 886 | OGS_TransitRSMacq.xyz | 11 | 25 | POLYGON ((187495.264 -2646111.108, 190079.294 ... |
| 547 | ANA06A.xyz | 11 | 25 | POLYGON ((197463.987 -2598392.278, 200575.641 ... |
| 544 | NBP0209.xyz | 11 | 25 | POLYGON ((-424.548 -2406206.571, -423.528 -240... |
[5]:
fig = ptk.basemap(
    region=ptk.regions.antarctica,
    coast=True,
    coast_pen="0.1,black",
    title="IBCSO data coverage",
    hemisphere="south",
)
# plot the points
fig.plot(
    data=points_gdf[::10],  # decrease the number of points to plot
    style="p",
    fill="magenta",
    label="Points",
)

# plot the polygons
fig.plot(
    data=polygons_gdf,
    close=True,
    fill="cyan",
    label="Polygons",
)

fig.legend()

fig.show(dpi=200)
[ ]: