Basemaps#
Here we will show the three options we have for basemaps. These can either be created as backgrounds for plotting your gridded / point data on top of, or used by themselves.
Either set the parameters simple_basemap, imagery_basemap,or modis_basemap to True in either function plot_grid() or basemap().
Alternatives, use the equivalent functions on existing figures: add_simple_basemap(), add_imagery(), or add_modis().
Import the modules
[1]:
import polartoolkit as ptk
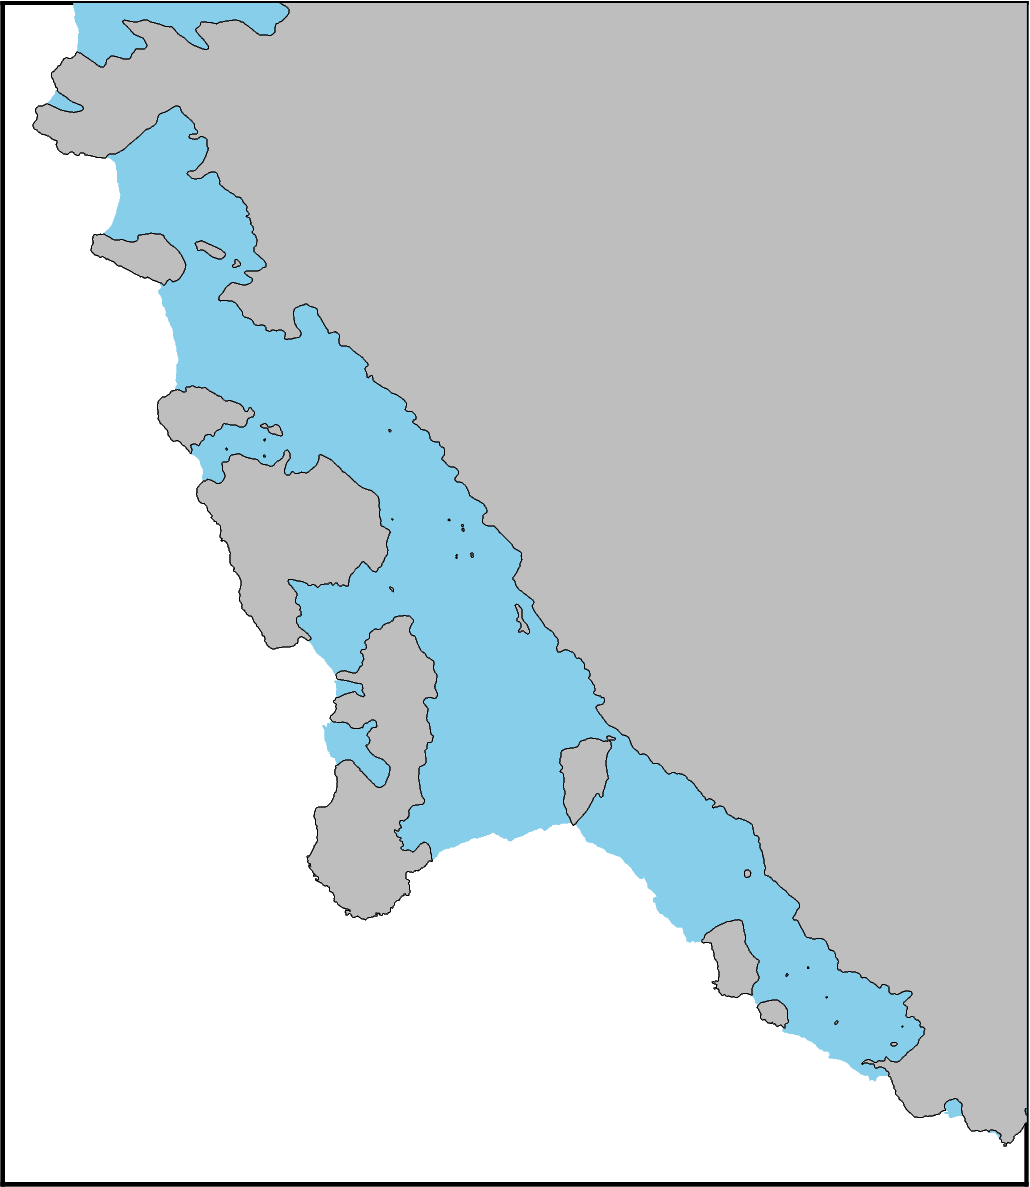
Basemap of grounded vs floating ice#
[2]:
# by default uses Depoorter et al. 2013 shapefiles for Antarctica
fig = ptk.basemap(
    simple_basemap=True,
    region=ptk.regions.getz_ice_shelf,
    hemisphere="south",
)

fig.show(dpi=200)
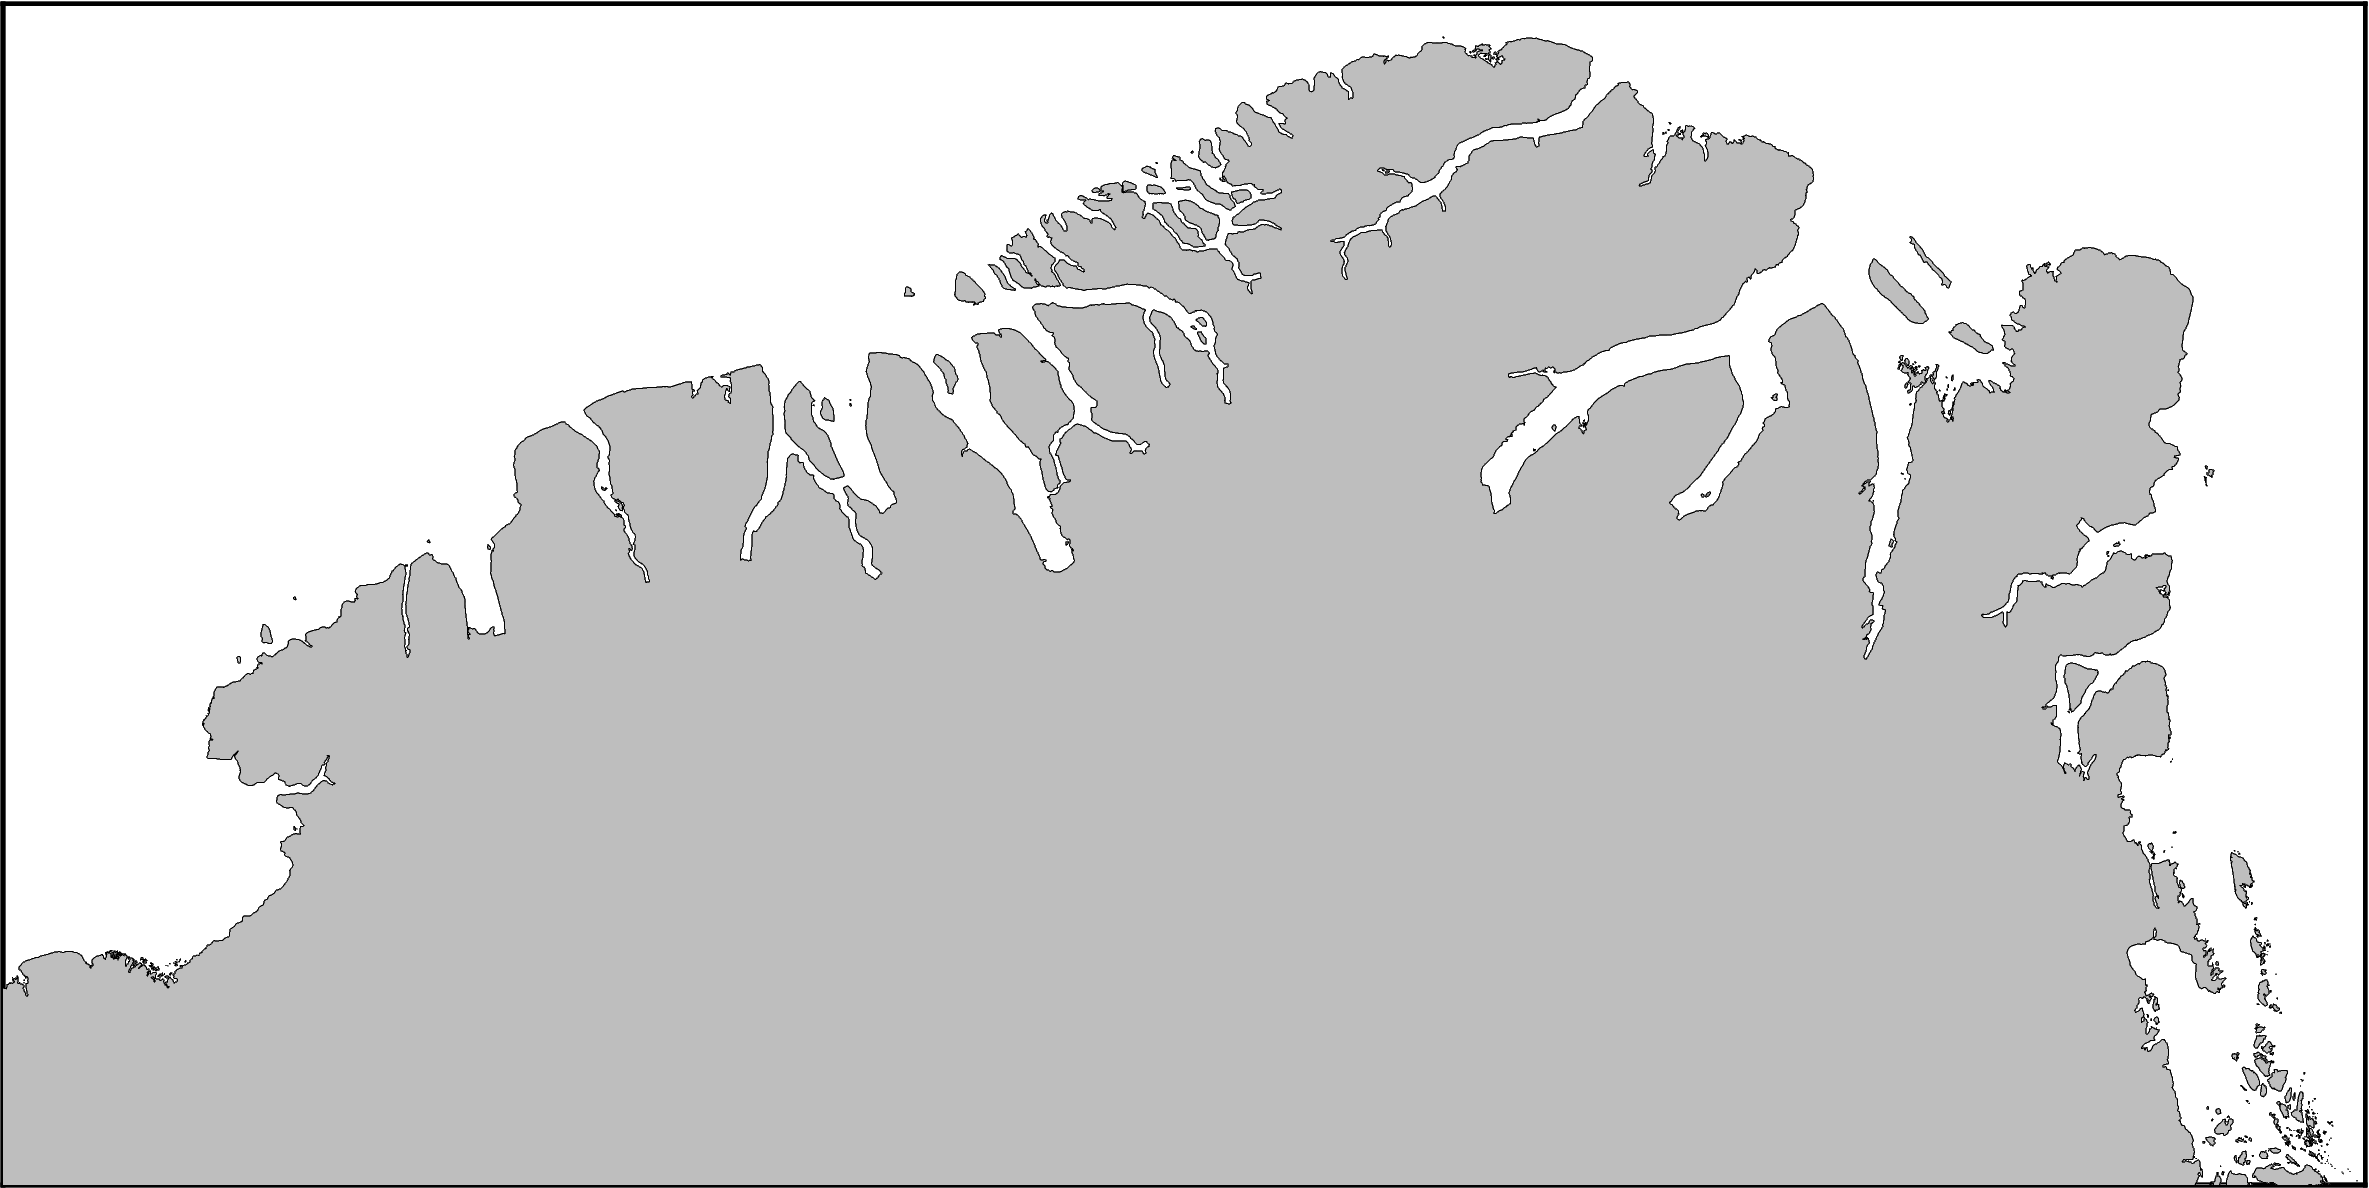
[3]:
# by default uses BAS shapefiles for Greenland
fig = ptk.basemap(
    simple_basemap=True,
    region=ptk.regions.north_greenland,
    hemisphere="north",
)

fig.show(dpi=200)
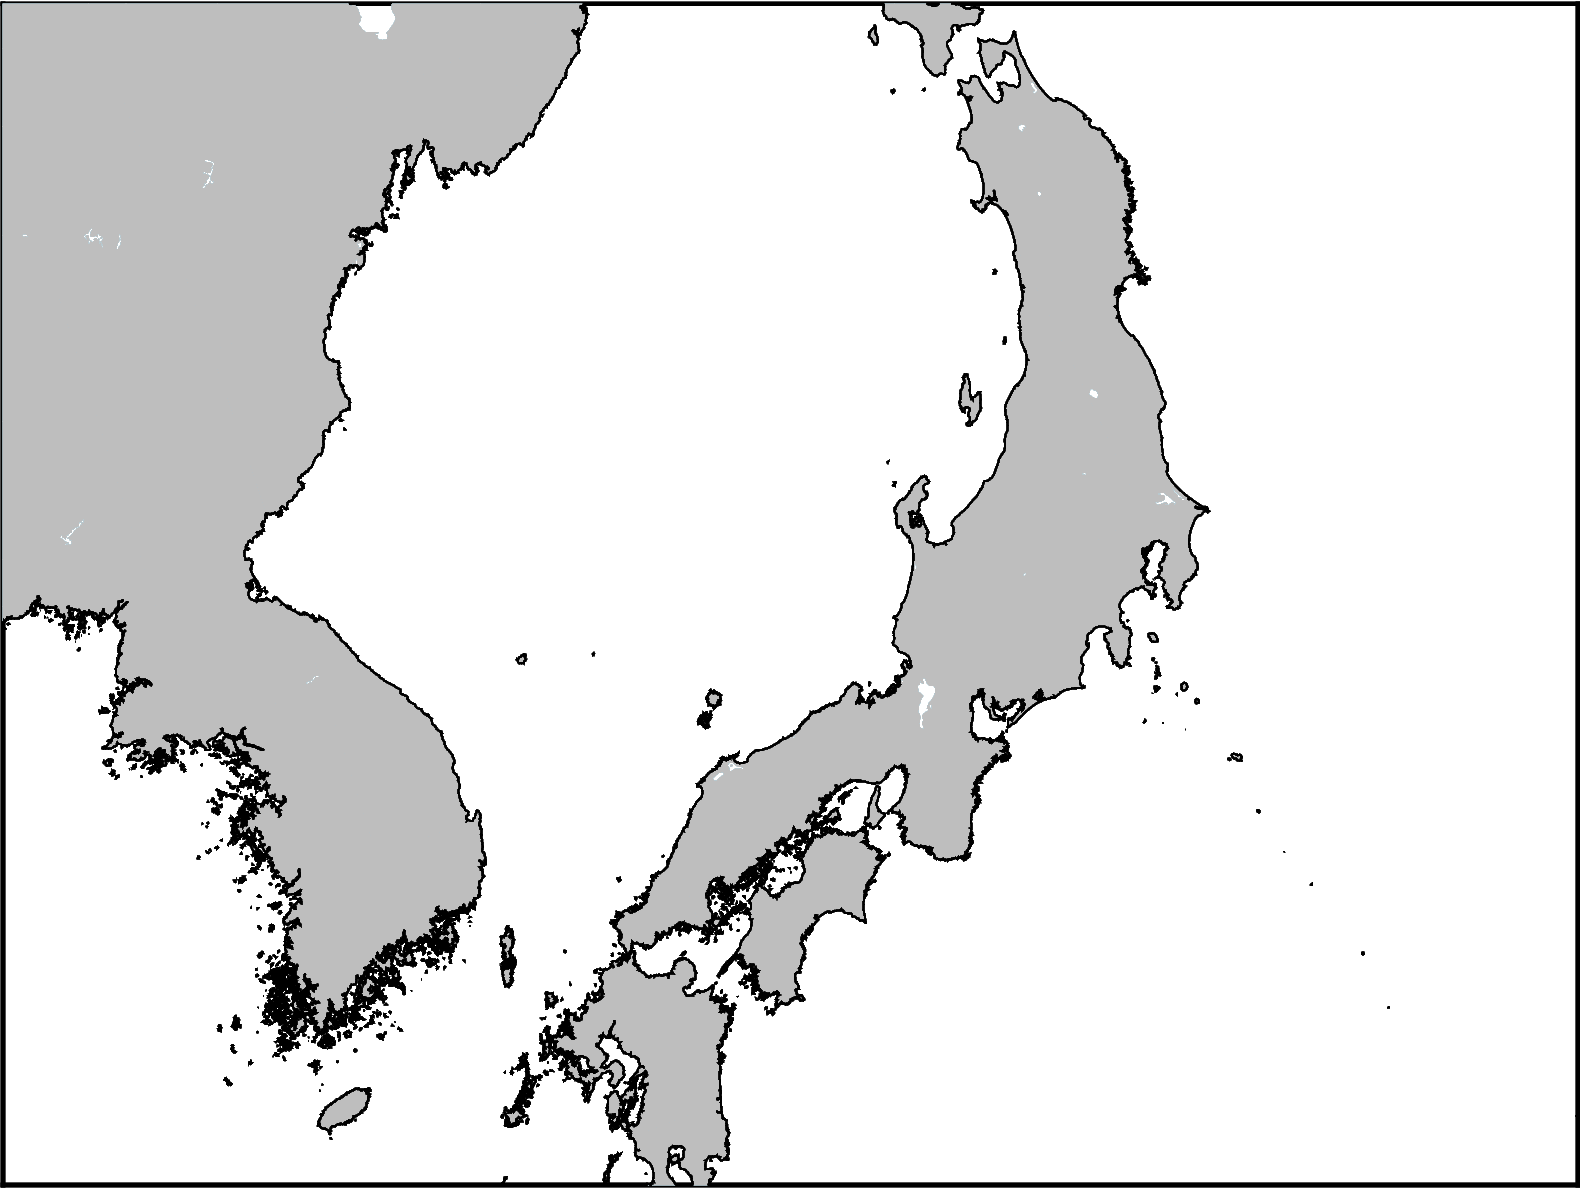
[ ]:
# by default uses the GMT GSHHG database for other projections
fig = ptk.basemap(
    simple_basemap=True,
    coast=True,
    region=(
        2000e3,
        4000e3,
        -1000e3,
        500e3,
    ),  # 2000km x 1500km region
    epsg="10594",  # EPSG of Asia
)

fig.show(dpi=200)
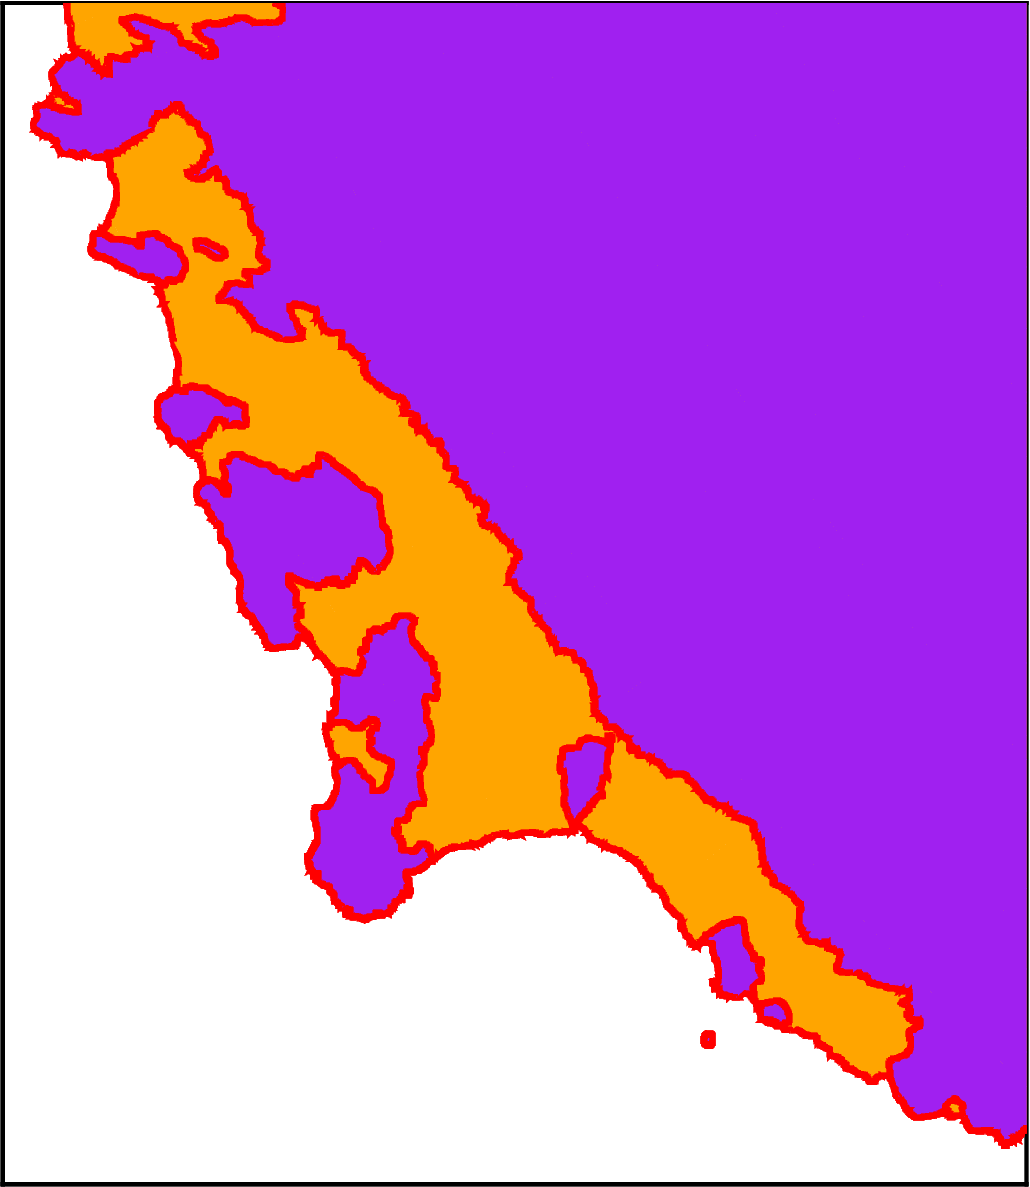
[10]:
# change the version of the simple basemap to use the GMT database and
# specify different colors
fig = ptk.basemap(
    simple_basemap=True,
    simple_basemap_version="gmt",
    simple_basemap_grounded_color="purple",
    simple_basemap_floating_color="orange",
    simple_basemap_pen="2p,red",
    region=ptk.regions.getz_ice_shelf,
    hemisphere="south",
)

fig.show(dpi=200)
Add to existing figure#
This will cover any portions of the existing figure for grounded or floating ice. You can supply options kwarg transparency to make the simple basemap transparent.
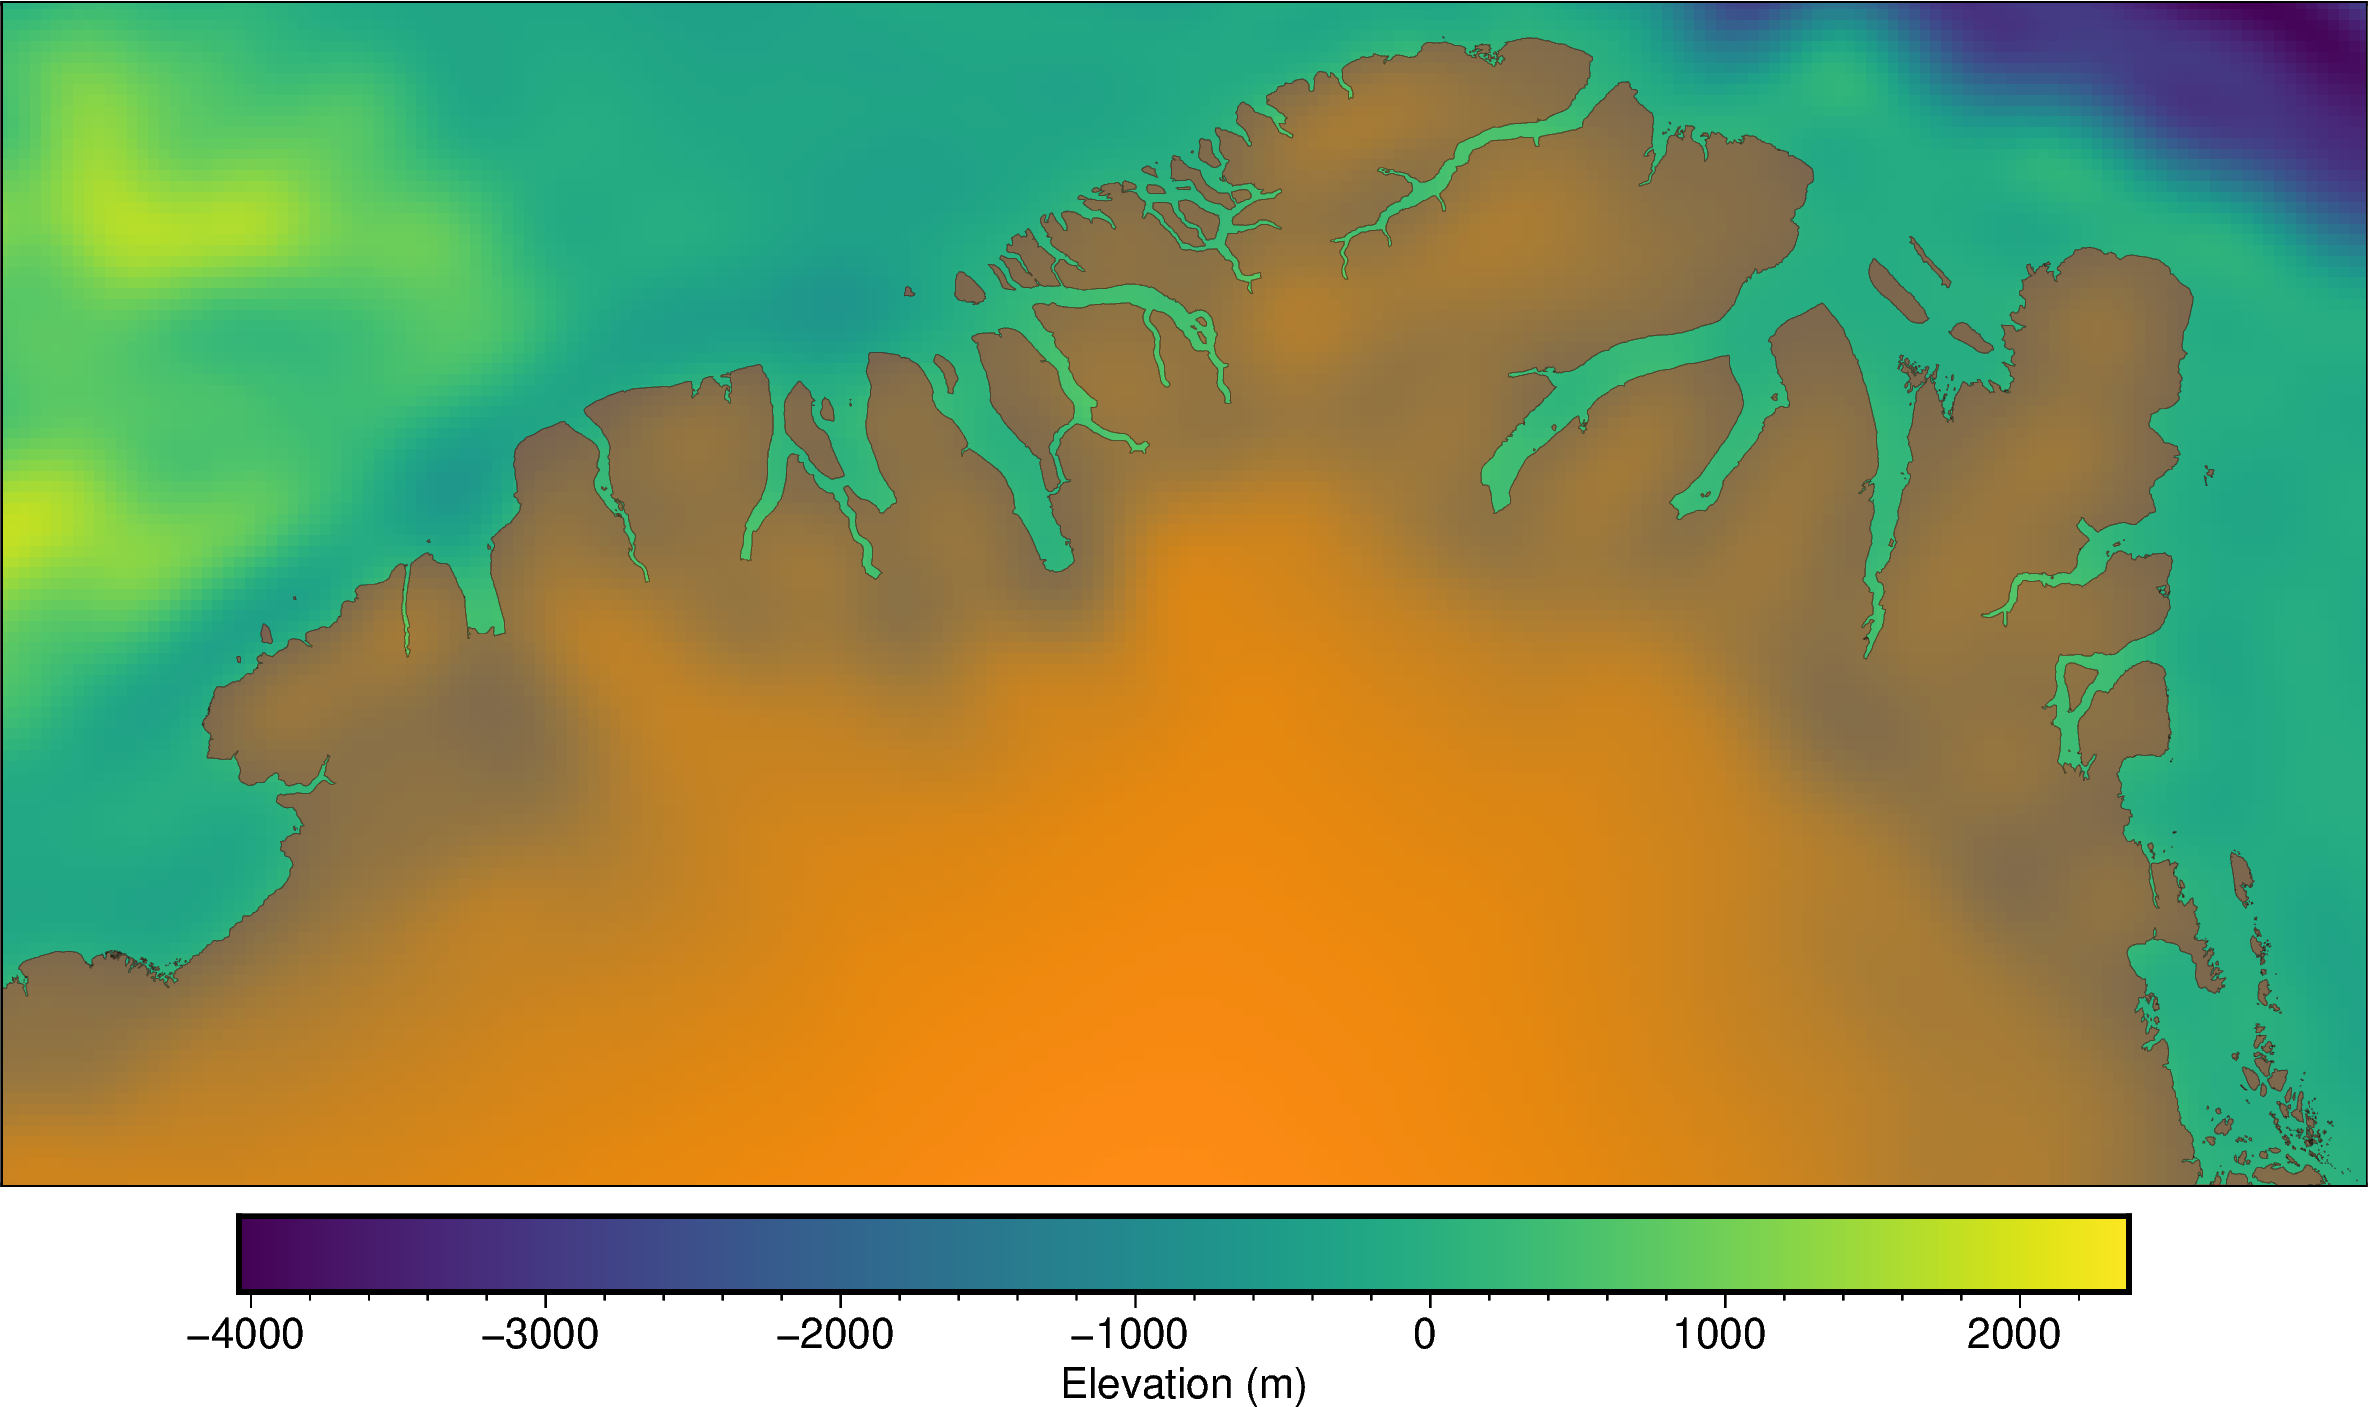
[11]:
# create figure
fig = ptk.plot_grid(
    ptk.fetch.etopo(hemisphere="north"),
    region=ptk.regions.north_greenland,
    cbar_label="Elevation (m)",
    hemisphere="north",
)

# add the basemap
fig.add_simple_basemap(
    grounded_color="red",
    transparency=60,
)
fig.show(dpi=200)
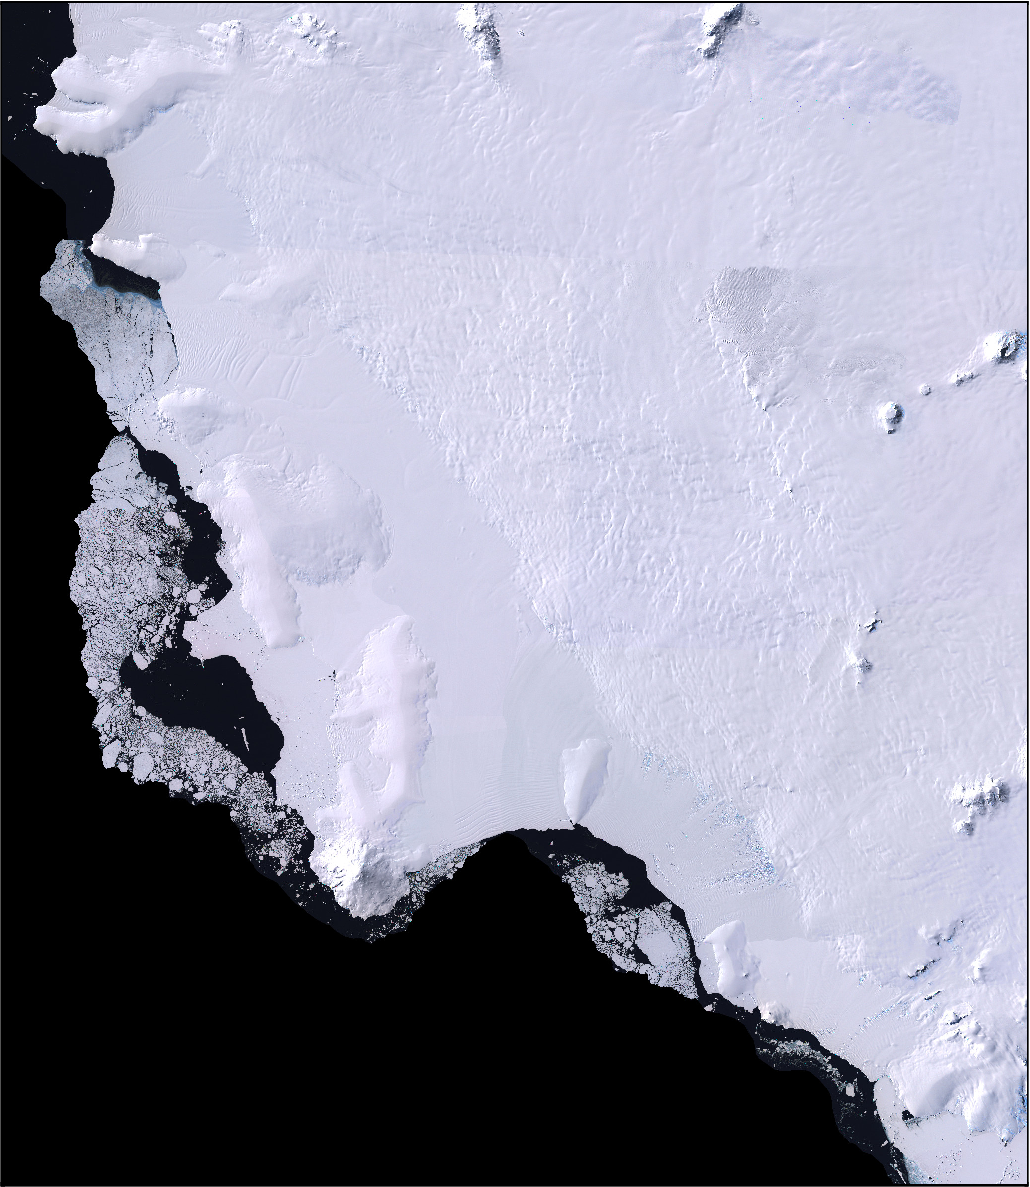
Satellite imagery basemap#
[12]:
fig = ptk.basemap(
    imagery_basemap=True,
    region=ptk.regions.getz_ice_shelf,
    hemisphere="south",
)

fig.show(dpi=200)
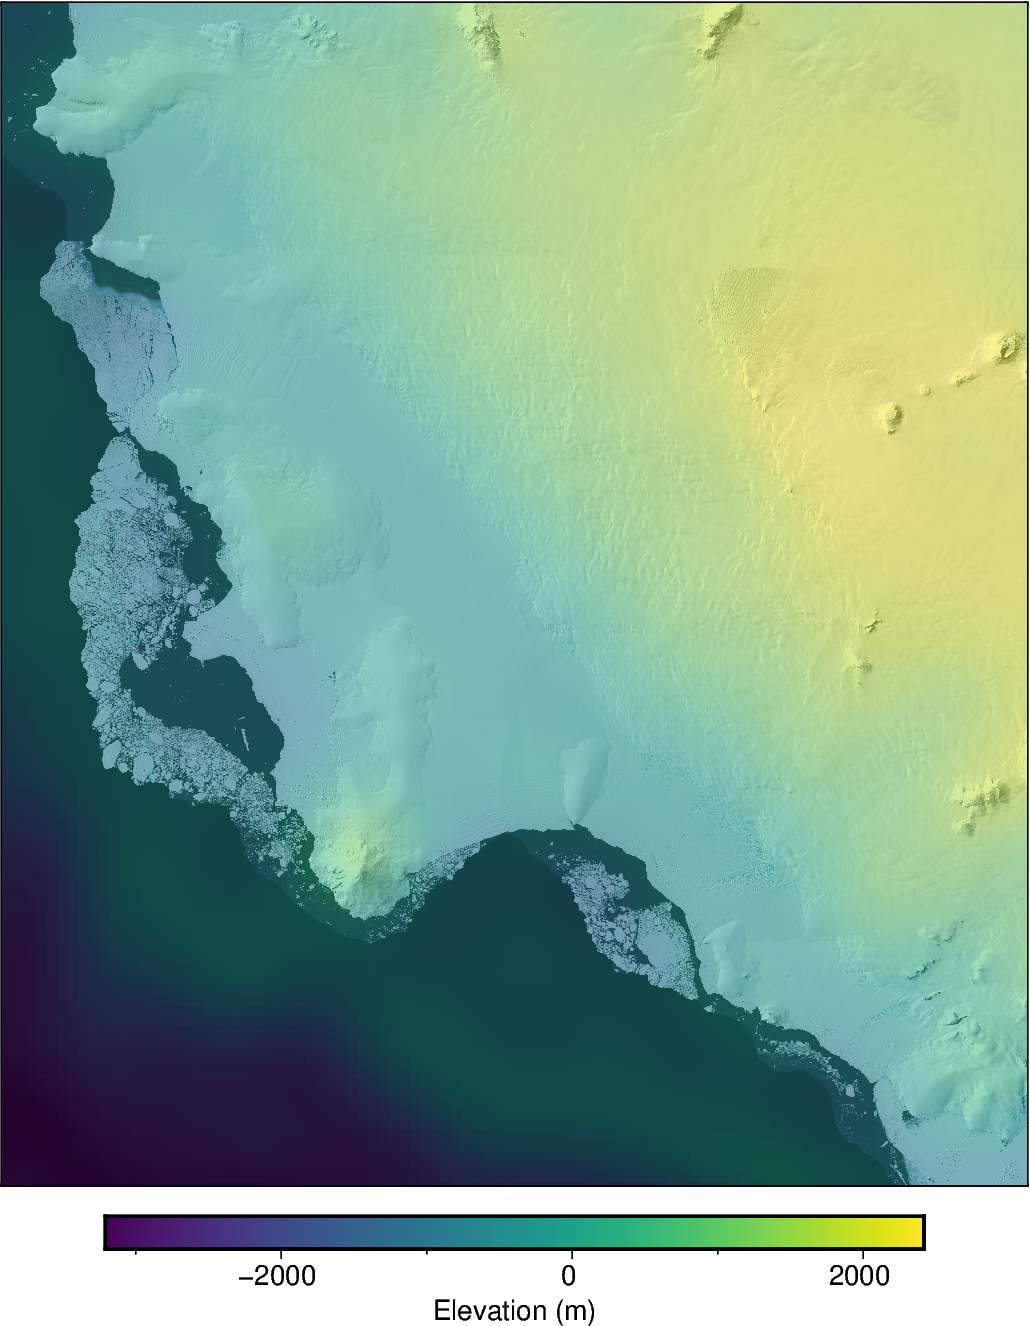
Add to existing figure#
[13]:
# create figure
fig = ptk.plot_grid(
    ptk.fetch.etopo(hemisphere="south"),
    region=ptk.regions.getz_ice_shelf,
    cbar_label="Elevation (m)",
    hemisphere="south",
)

# add the LIMA imagery, but make it semi-transparent to be able to see grid values
# behind
fig.add_imagery(
    transparency=50,
)
fig.show(dpi=200)
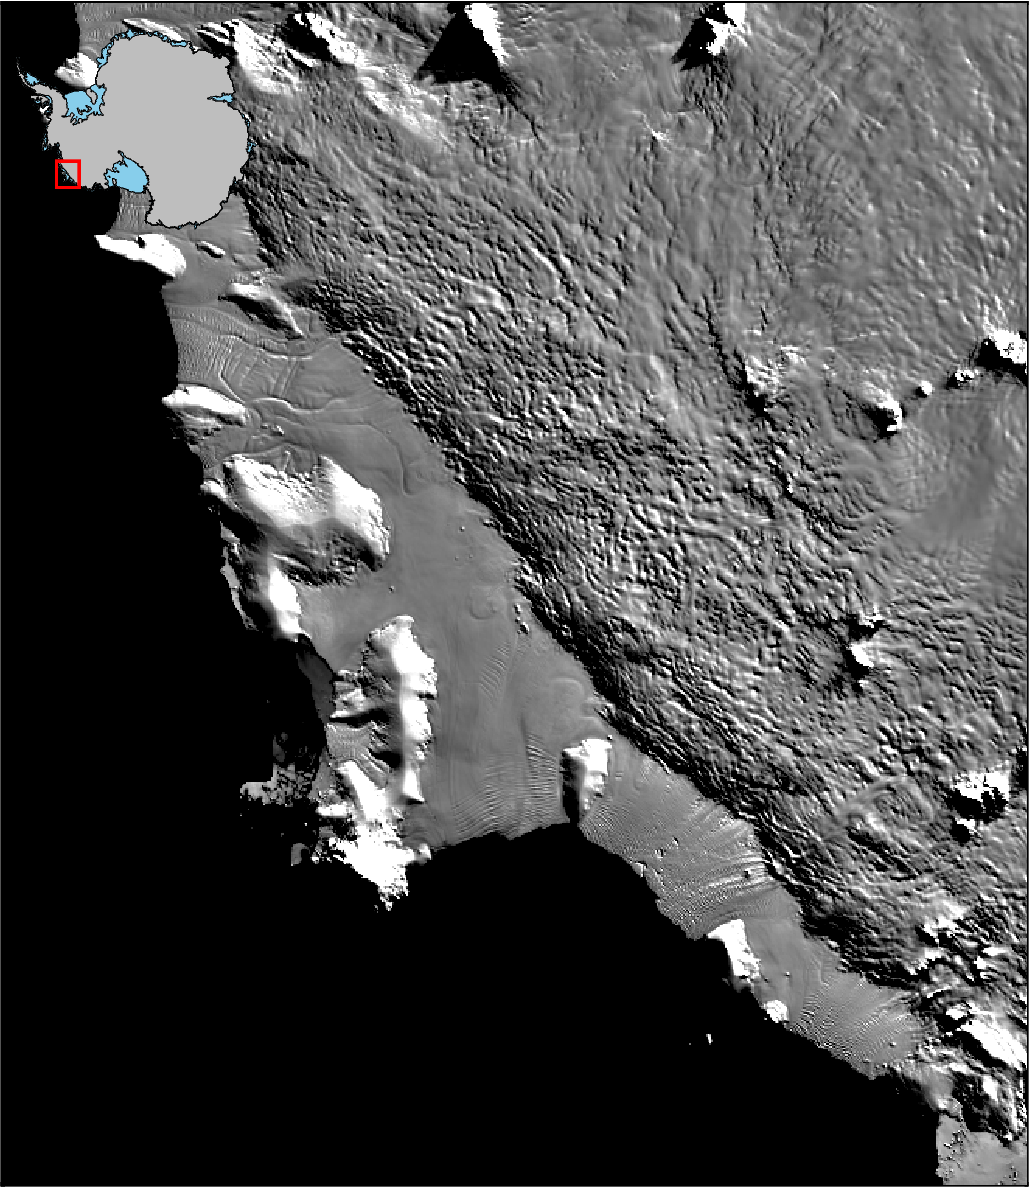
MODIS imagery basemap#
[14]:
# by default for Antarctica is 750 m MODIS resolution
fig = ptk.basemap(
    modis_basemap=True,
    region=ptk.regions.getz_ice_shelf,
    # modis_version="125m", # uncomment this to use 125 m resolution MODIS imagery
    hemisphere="south",
    inset=True,
)
fig.show(dpi=200)
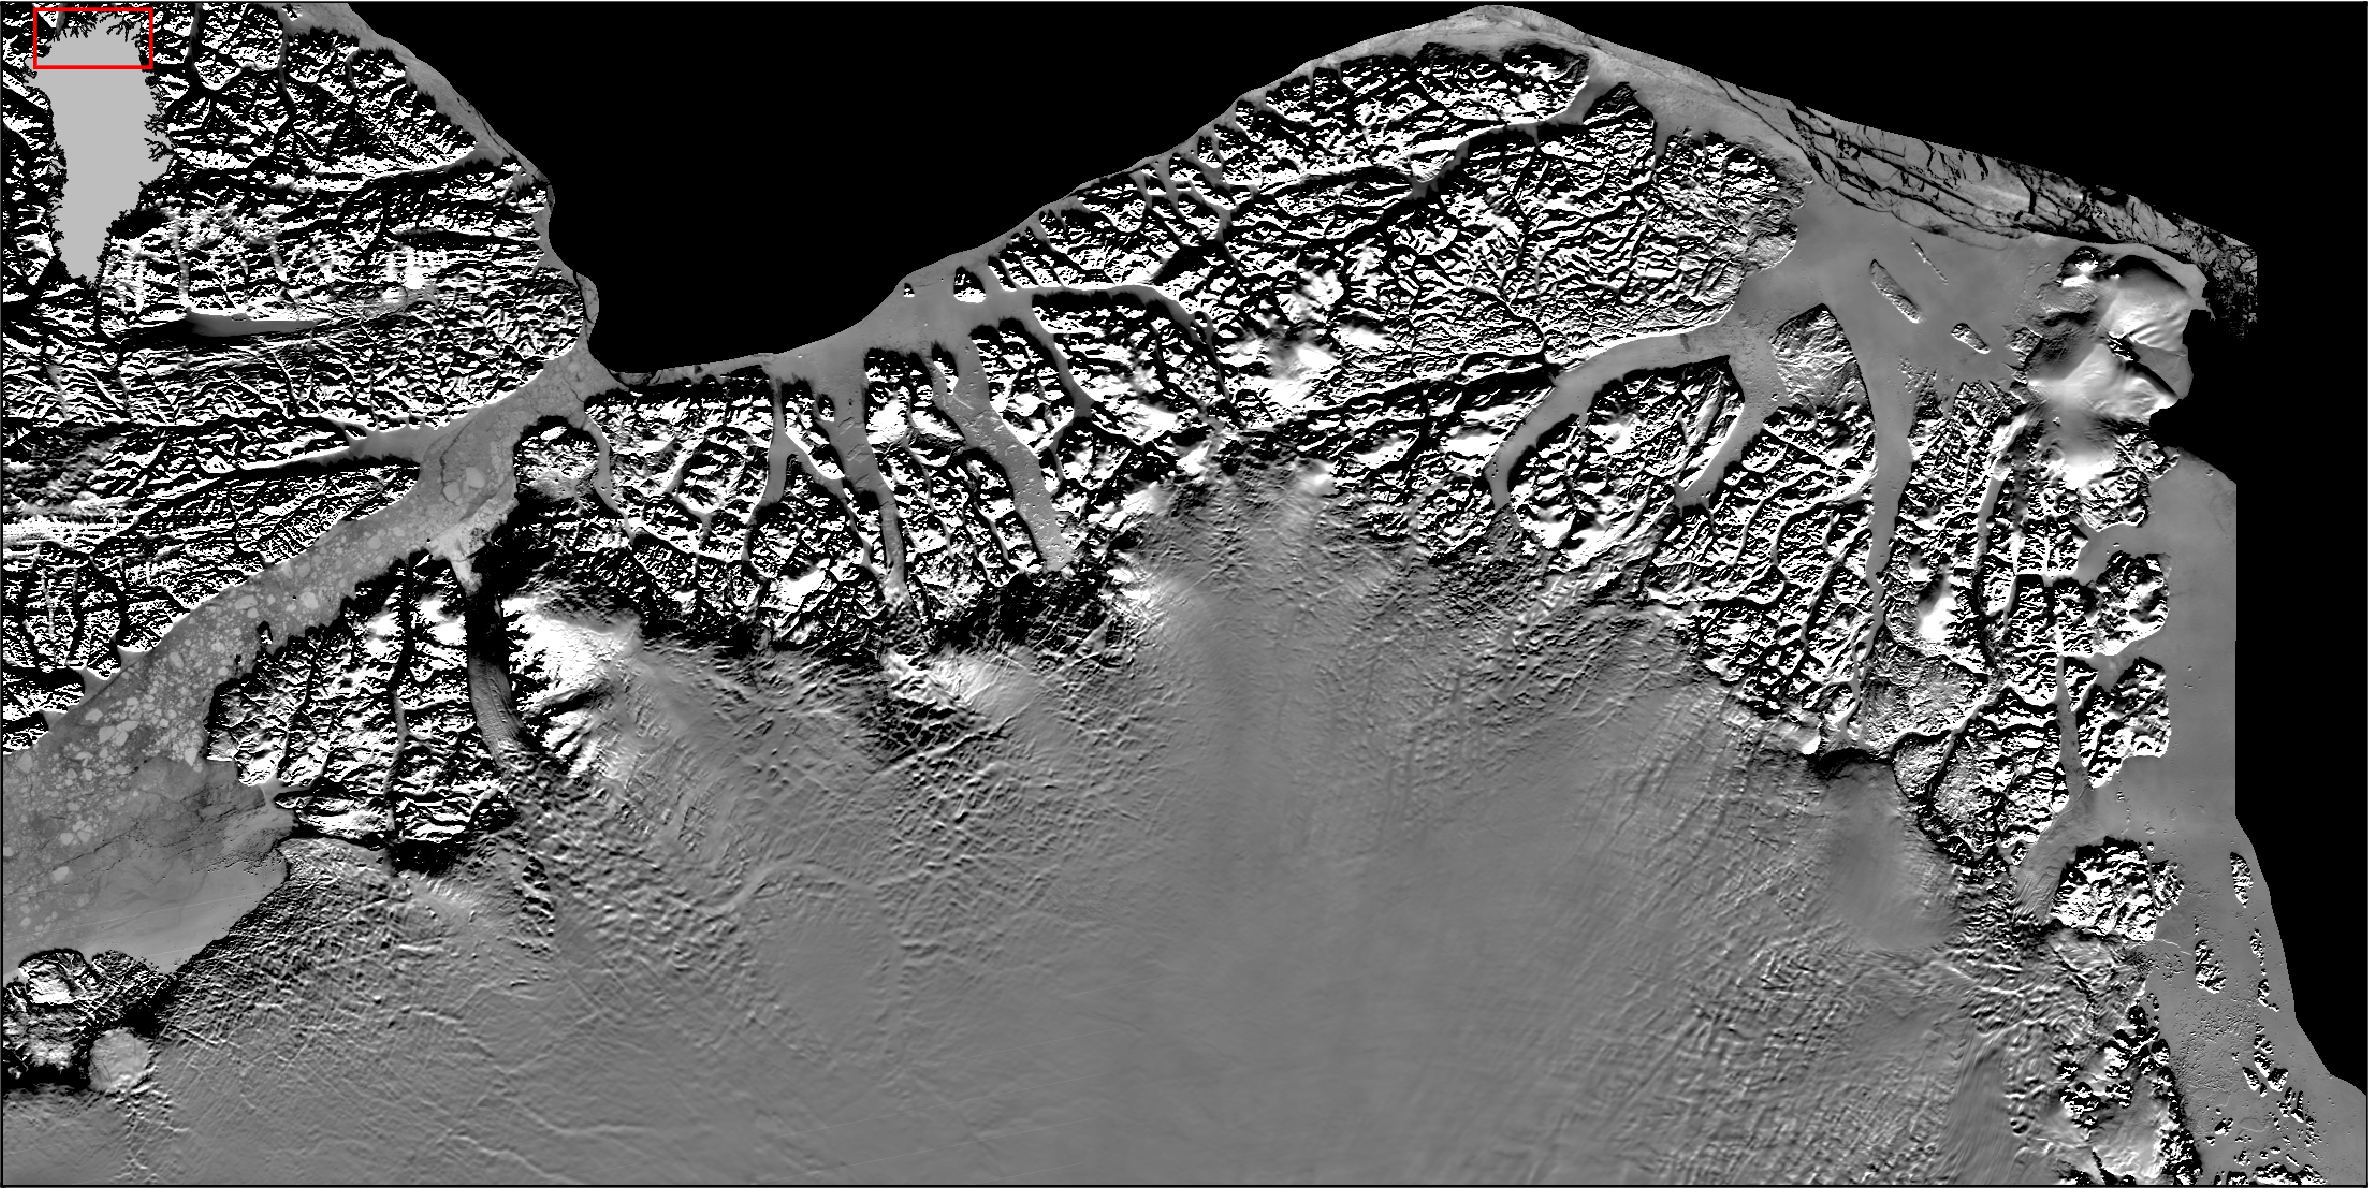
[15]:
# equivalent for the northern hemisphere, by default uses 500 m MODIS resolution
fig = ptk.basemap(
    modis_basemap=True,
    hemisphere="north",
    region=ptk.regions.north_greenland,
    inset=True,
)

fig.show(dpi=200)
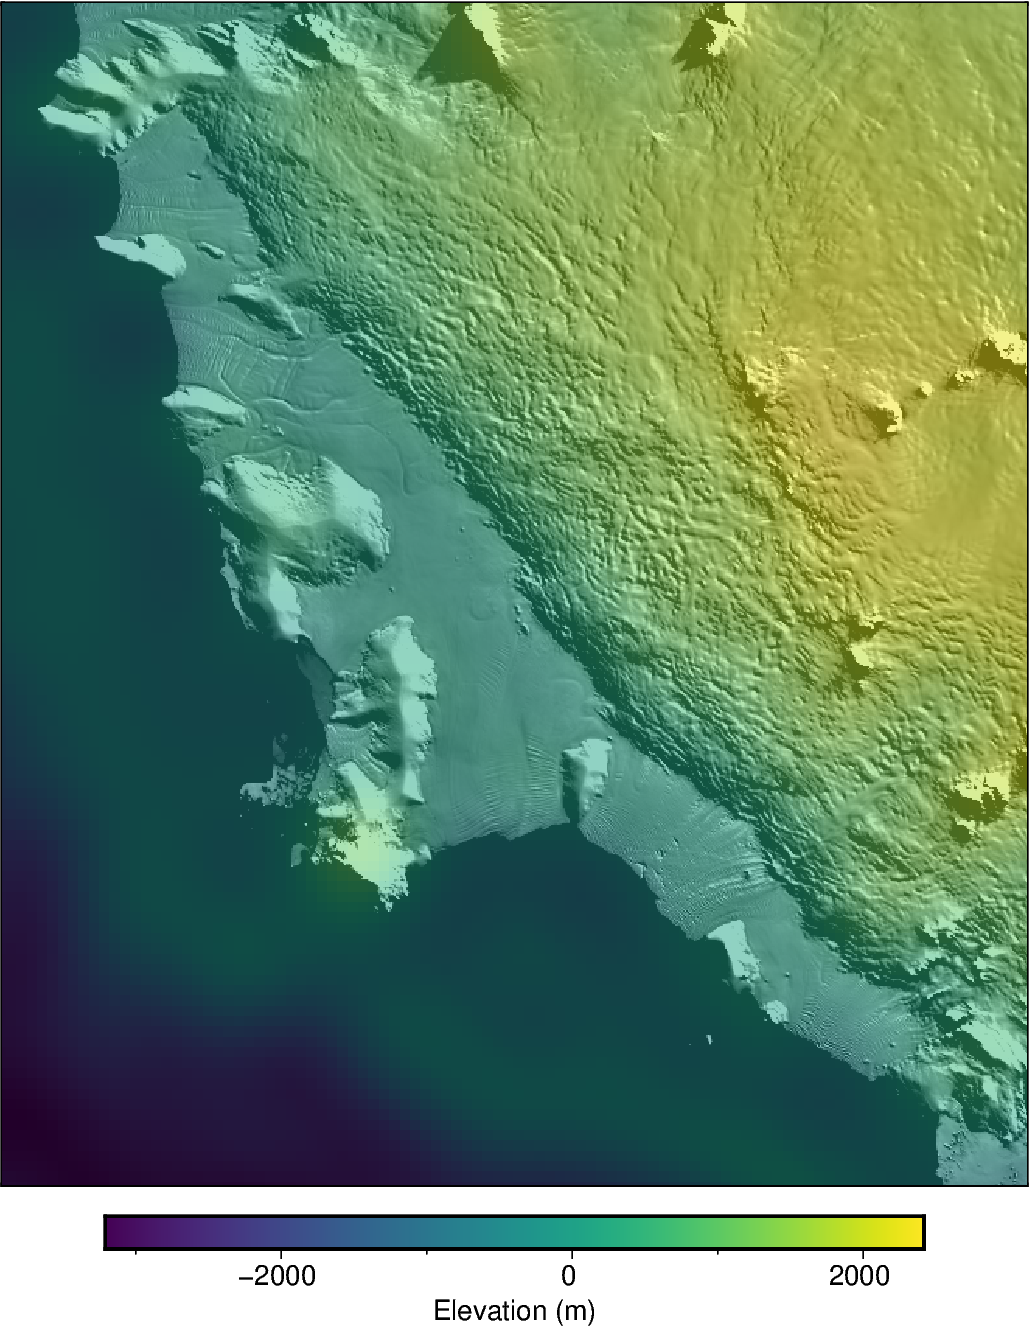
Add to existing figure#
[16]:
# create figure
fig = ptk.plot_grid(
    ptk.fetch.etopo(hemisphere="south"),
    region=ptk.regions.getz_ice_shelf,
    cbar_label="Elevation (m)",
    hemisphere="south",
)

# add the MODIS imagery, but make it semi-transparent to be able to see grid values
# behind
fig.add_modis(
    transparency=50,
)
fig.show(dpi=200)
[ ]: