MODIS MOA#
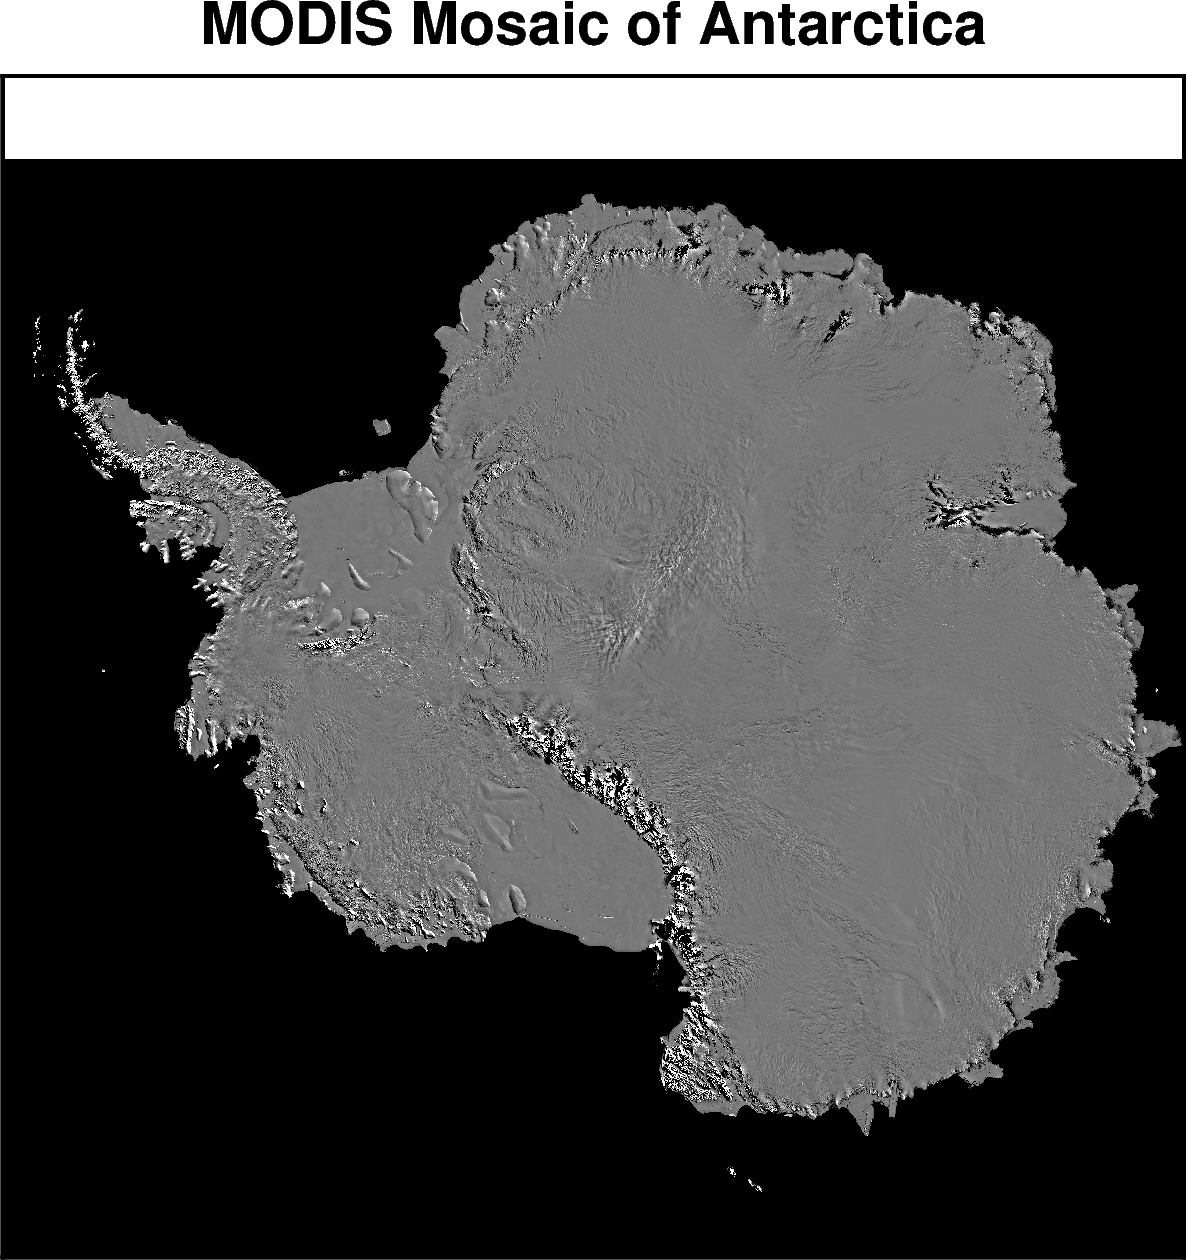
Description: MODIS optical image mosaic of Antarctica.
Requires an EarthData login, see link for how to configure this.
Dataset:
Haran, T., J. Bohlander, T A Scambos, T. Painter, and M. Fahnestock. “MODIS Mosaic of Antarctica 2008-2009 (MOA2009) Image Map, Version 2,” 2021. https://doi.org/10.5067/4ZL43A4619AF.
Associated paper:
Scambos, T.A., T.M. Haran, M.A. Fahnestock, T.H. Painter, and J. Bohlander. “MODIS-Based Mosaic of Antarctica (MOA) Data Sets: Continent-Wide Surface Morphology and Snow Grain Size.” Remote Sensing of Environment 111, no. 2–3 (2007): 242–57. https://doi.org/10.1016/j.rse.2006.12.020.
[1]:
import os

import polartoolkit as ptk
[2]:
# set default to southern hemisphere for this notebook
os.environ["POLARTOOLKIT_HEMISPHERE"] = "south"
[3]:
fpath = ptk.fetch.modis(
    # choose which resolution to use
    version="750m",
    # version="125m"
)
fpath
[3]:
'/home/mdtanker/.cache/pooch/polartoolkit/imagery/moa750_2009_hp1_v02.0.tif'
[4]:
# instead of passing the imagery filepath to `plot_grid`, we can use the keyword argument
# `modis_basemap=True` to either `plot_grid()` or `basemap()`
fig = ptk.basemap(
    region=ptk.regions.antarctica,
    modis_basemap=True,
    title="MODIS Mosaic of Antarctica",
    modis=True,  # this automatically uses a nice colorscale for modis data
)
fig.show(dpi=200)
[ ]: