ETOPO1 Surface Topography#
Description: A grid of surface topography originally at 10 arc-min resolution.
Dataset:
Uieda, Leonardo. “Fatiando a Terra Data: Earth - Topography Grid at 10 Arc-Minute Resolution.” Zenodo, January 20, 2022. https://doi.org/10.5281/zenodo.5882203.
Associated paper:
“ETOPO1 1 Arc-Minute Global Relief Model: Procedures, Data Sources and Analysis.” National Geophysical Data Center, NOAA, 2009. https://doi.org/10.7289/V5C8276M.
[1]:
%%capture
%load_ext autoreload
%autoreload 2

from polartoolkit import fetch, maps, utils
[2]:
data = fetch.etopo(
    hemisphere="south",
    # available options
    # region,
    # spacing,
    # registration ("g" for gridline or "p" for pixel),
)
data
[2]:
<xarray.DataArray 'z' (y: 1401, x: 1401)> Size: 16MB
array([[-4962.7890625 , -4967.10302734, -4966.47558594, ...,
        -4203.62792969, -4212.6640625 , -4218.30566406],
       [-4968.39404297, -4972.77148438, -4972.49804688, ...,
        -4197.68798828, -4206.75146484, -4212.06689453],
       [-4974.98925781, -4979.91699219, -4980.95947266, ...,
        -4190.64550781, -4200.02392578, -4205.4921875 ],
       ...,
       [-5394.29150391, -5399.44726562, -5401.72167969, ...,
        -2656.77587891, -2560.75317383, -2463.20947266],
       [-5372.69042969, -5379.14306641, -5383.84619141, ...,
        -2618.7253418 , -2520.79614258, -2421.49829102],
       [-5352.55273438, -5359.63867188, -5365.90625   , ...,
        -2585.31494141, -2485.53979492, -2386.65234375]])
Coordinates:
  * y        (y) float64 11kB -3.5e+06 -3.495e+06 ... 3.495e+06 3.5e+06
  * x        (x) float64 11kB -3.5e+06 -3.495e+06 ... 3.495e+06 3.5e+06
Attributes:
    Conventions:   CF-1.7
    title:
    history:       gmt grdsample @GMTAPI@-S-I-G-M-G-N-000000 -G@GMTAPI@-S-O-G...
    description:
    long_name:     z
actual_range: [-7946.32617188 4089.17773438][3]:
_ = utils.get_grid_info(data, print_info=True)
grid spacing: 5000.0 m
grid region: (-3500000.0, 3500000.0, -3500000.0, 3500000.0)
grid zmin: -7946.32617188
grid zmax: 4089.17773438
grid registration: g
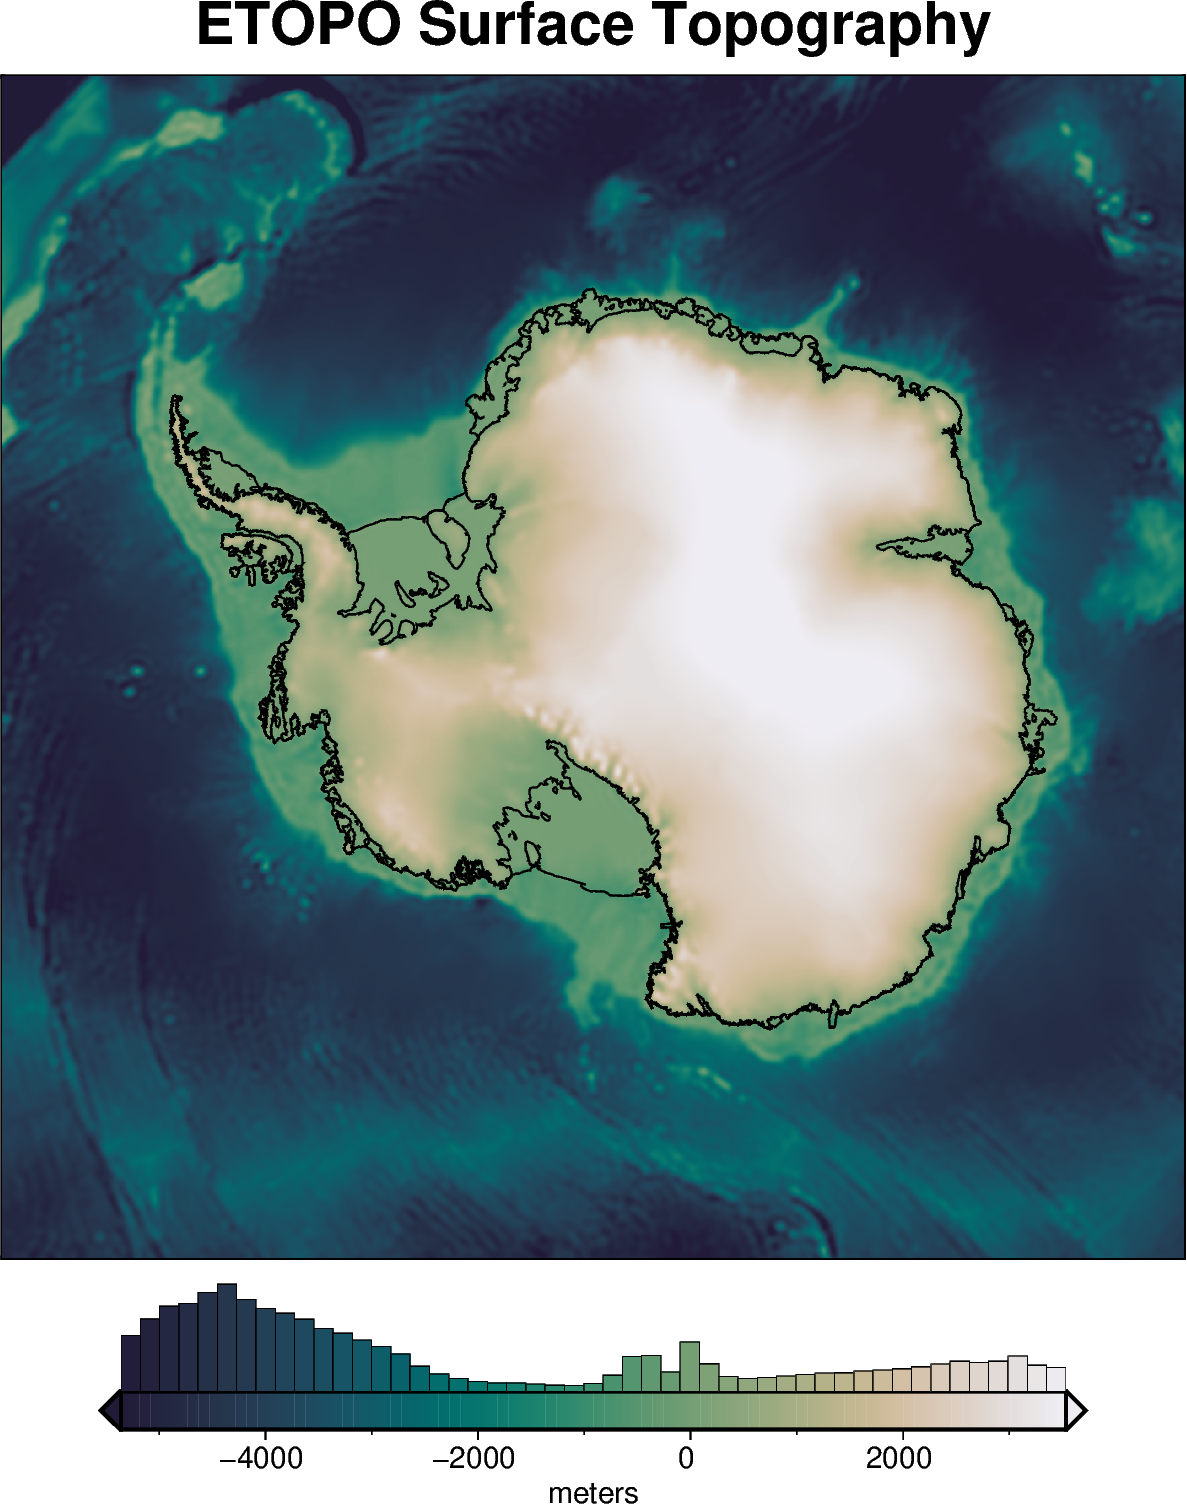
[4]:
fig = maps.plot_grd(
    data,
    title="ETOPO Surface Topography",
    coast=True,
    cbar_label="meters",
    hist=True,
    robust=True,
    cmap="rain",
    reverse_cpt=True,
    hemisphere="south",
)

fig.show(dpi=200)
[ ]: