7. Plotting point data#
PolarToolkit also supports some plotting of point data (non-gridded). Here we will download a dataset and make a simple plot.
Import the necessary modules
[2]:
from polartoolkit import fetch, maps, regions
Fetch a pandas dataframe of point measurements of Antarctic geothermal heat flux.
[3]:
df = fetch.ghf(version="burton-johnson-2020", points=True)
df.describe()
[3]:
| lat | lon | top (m) | GHF | Elevation (m.a.s.l.) | x | y | |
|---|---|---|---|---|---|---|---|
| count | 187.000000 | 187.000000 | 101.000000 | 187.000000 | 146.000000 | 1.870000e+02 | 1.870000e+02 |
| mean | -72.093118 | -3.583310 | 18.473861 | 74.605187 | -1486.657534 | -6.084263e+05 | -1.991335e+05 |
| std | 5.992076 | 119.444584 | 49.536576 | 40.324318 | 1271.643419 | 1.519346e+06 | 1.271202e+06 |
| min | -90.000000 | -179.960000 | 0.000000 | -31.000000 | -5281.000000 | -2.534092e+06 | -1.983563e+06 |
| 25% | -76.380000 | -104.729000 | 0.000000 | 50.500000 | -2495.250000 | -1.730710e+06 | -1.305977e+06 |
| 50% | -74.349000 | -50.159200 | 0.760000 | 70.000000 | -893.000000 | -1.063271e+06 | -4.595344e+05 |
| 75% | -66.545833 | 130.500000 | 2.160000 | 93.000000 | -645.000000 | 3.937210e+05 | 7.988703e+05 |
| max | -60.835000 | 179.966700 | 260.000000 | 285.000000 | 349.000000 | 2.615168e+06 | 2.192803e+06 |
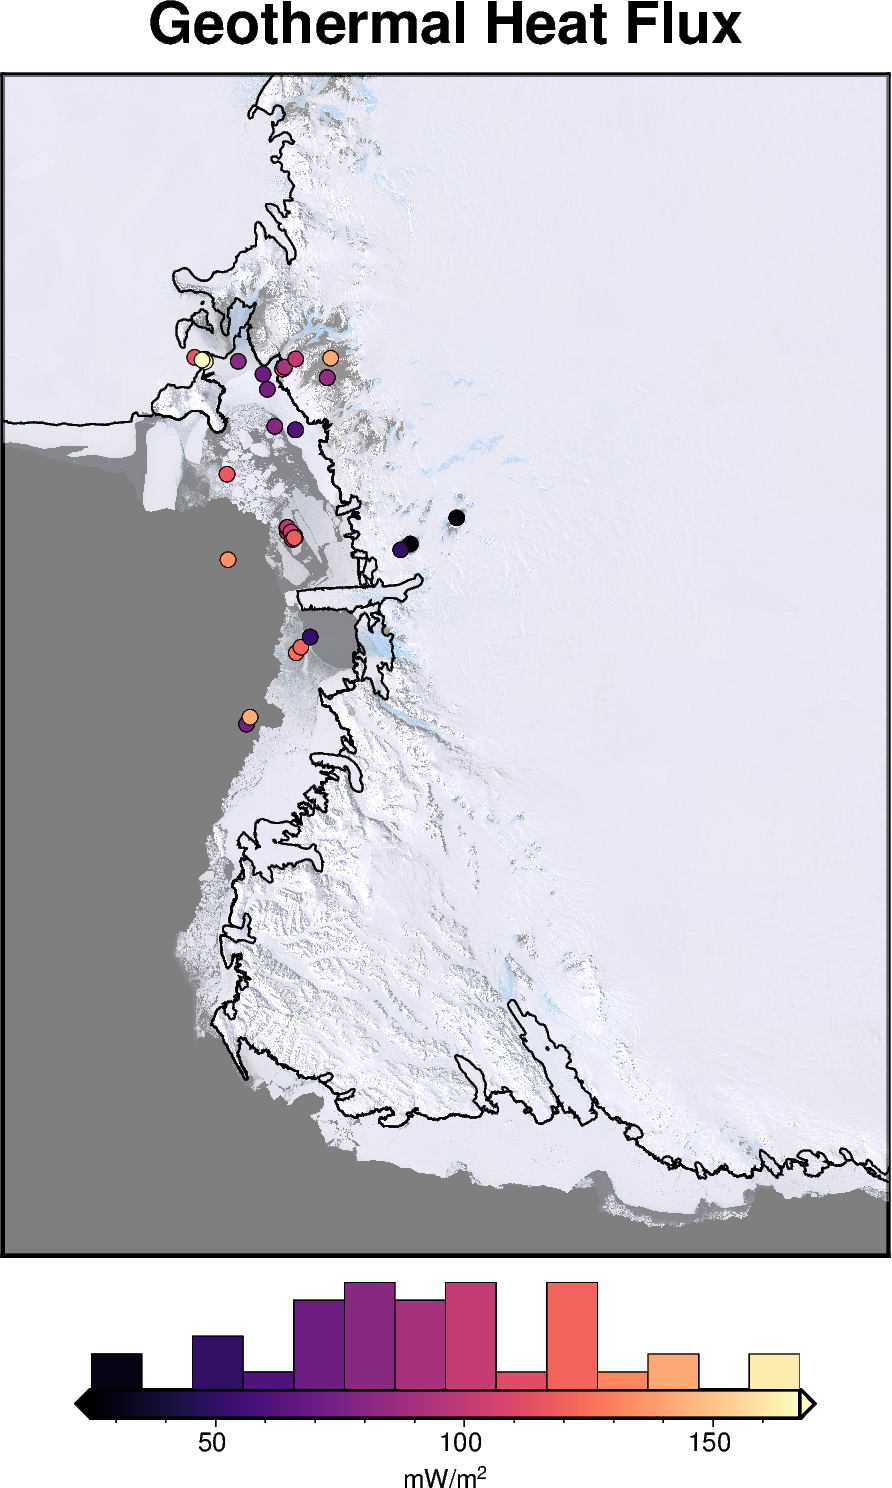
Use the basemap function to make a figure instance, and add the points to that.
[4]:
fig = maps.basemap(
    region=regions.victoria_land,
    title="Geothermal Heat Flux",
    imagery_basemap=True,
    imagery_transparency=50,
    coast=True,
    hemisphere="south",
    points=df,
    points_cmap="magma",
    points_fill="GHF",
    points_pen=".2p,black",
    colorbar=True,
    hist=True,
    hist_bin_num=15,
    cbar_label="mW/m@+2@+",
)

fig.show(dpi=200)
grdimage [WARNING]: (w - x_min) must equal (NX + eps) * x_inc), where NX is an integer and |eps| <= 0.0001.
grdimage [WARNING]: w reset from 100000 to 99766.1470198
grdimage [WARNING]: (e - x_min) must equal (NX + eps) * x_inc), where NX is an integer and |eps| <= 0.0001.
grdimage [WARNING]: e reset from 1000000 to 1000045.54542
grdimage [WARNING]: (s - y_min) must equal (NY + eps) * y_inc), where NY is an integer and |eps| <= 0.0001.
grdimage [WARNING]: s reset from -2200000 to -2200065.03982
grdimage [WARNING]: (n - y_min) must equal (NY + eps) * y_inc), where NY is an integer and |eps| <= 0.0001.
grdimage [WARNING]: n reset from -1000000 to -999825.037242