Quickstart#
Here is a quick demonstration of some of the main things PolarToolkit can do. This assumes you know a bit of Python and have successfully installed this packaged. See the tutorials for a step-by-step introduction to PolarToolkit, and the how-to guides for more in-depth guides for specific features.
Import the various modules of PolarToolkit.
[1]:
from polartoolkit import fetch, maps, profiles, regions
Inform PolarToolkit that we are interested in the southern hemisphere (Antarctica) as opposed to the northern hemisphere (Arctic/Greenland) for this notebook.
[2]:
import os

os.environ["POLARTOOLKIT_HEMISPHERE"] = "south"
Use the PolarToolkit fetch module to download some gridded Antarctic ice thickness data from Bedmap3 and return the portion around the Amery Ice Shelf using the region module.
[3]:
ice_thickness = fetch.bedmap3(
    layer="ice_thickness",
    region=regions.amery_ice_shelf,
)
grdcut [WARNING]: (w - x_min) must equal (NX + eps) * x_inc), where NX is an integer and |eps| <= 0.0001.
grdcut [WARNING]: w reset from 1530000 to 1529750
grdcut [WARNING]: (e - x_min) must equal (NX + eps) * x_inc), where NX is an integer and |eps| <= 0.0001.
grdcut [WARNING]: e reset from 2460000 to 2460250
grdcut [WARNING]: (s - y_min) must equal (NY + eps) * y_inc), where NY is an integer and |eps| <= 0.0001.
grdcut [WARNING]: s reset from 430000 to 429750
grdcut [WARNING]: (n - y_min) must equal (NY + eps) * y_inc), where NY is an integer and |eps| <= 0.0001.
grdcut [WARNING]: n reset from 1000000 to 1000250
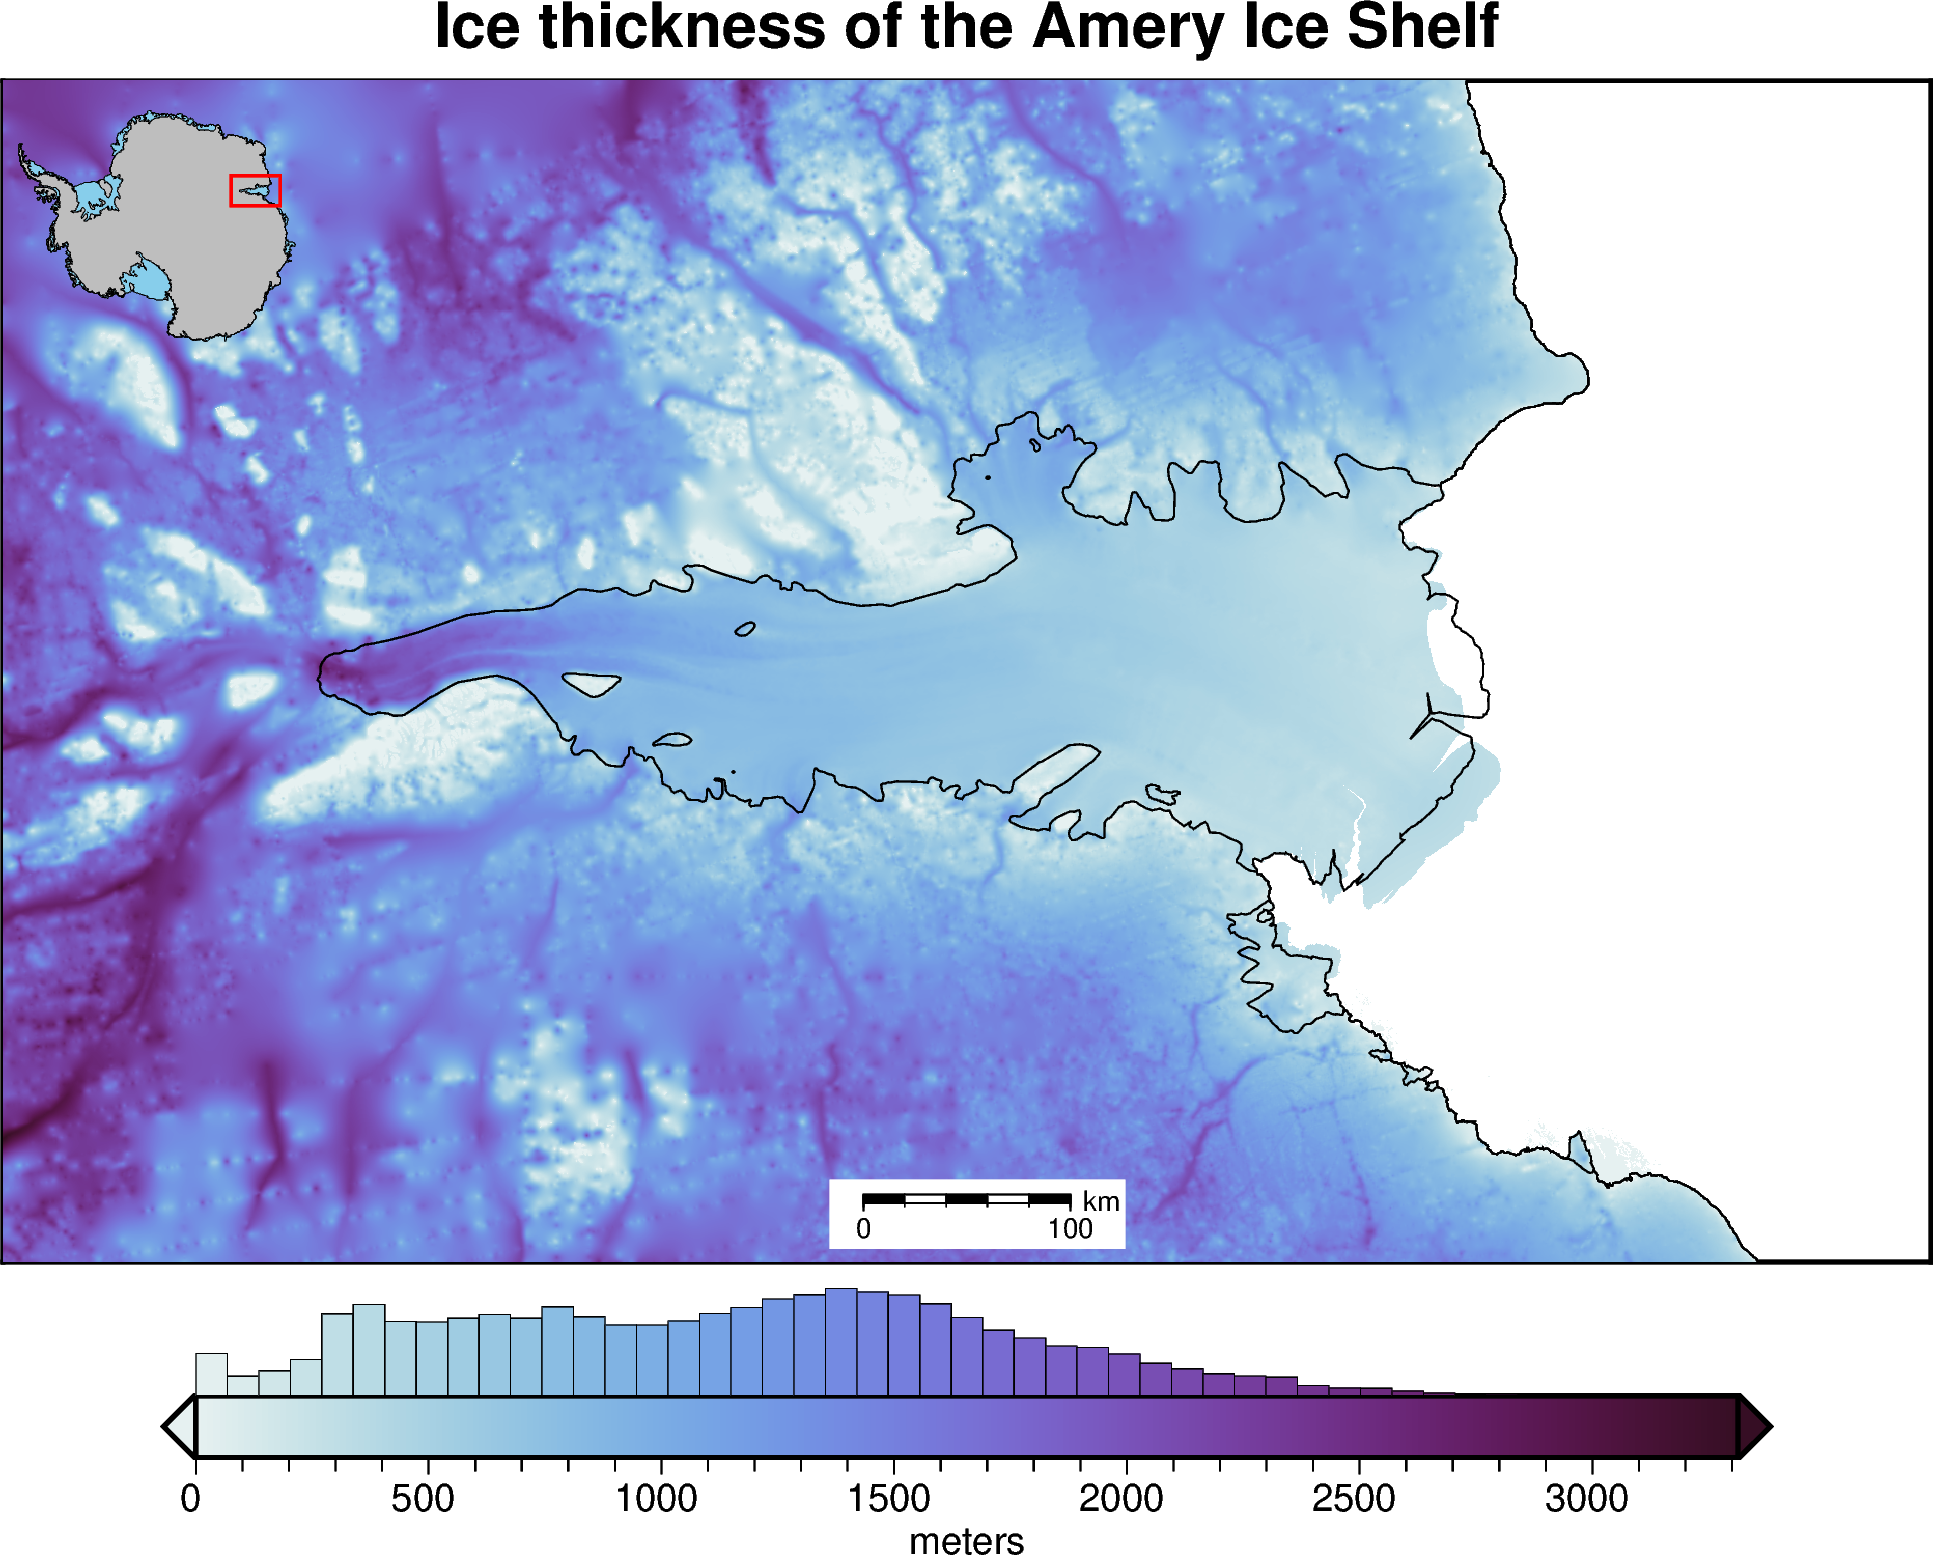
Create a simple map with a few optional embellishments with the maps module.
[4]:
fig = maps.plot_grd(
    ice_thickness,
    title="Ice thickness of the Amery Ice Shelf",
    cbar_label="meters",
    cmap="dense",
    inset=True,
    coast=True,
    scalebar=True,
    hist=True,
)

fig.show(dpi=200)
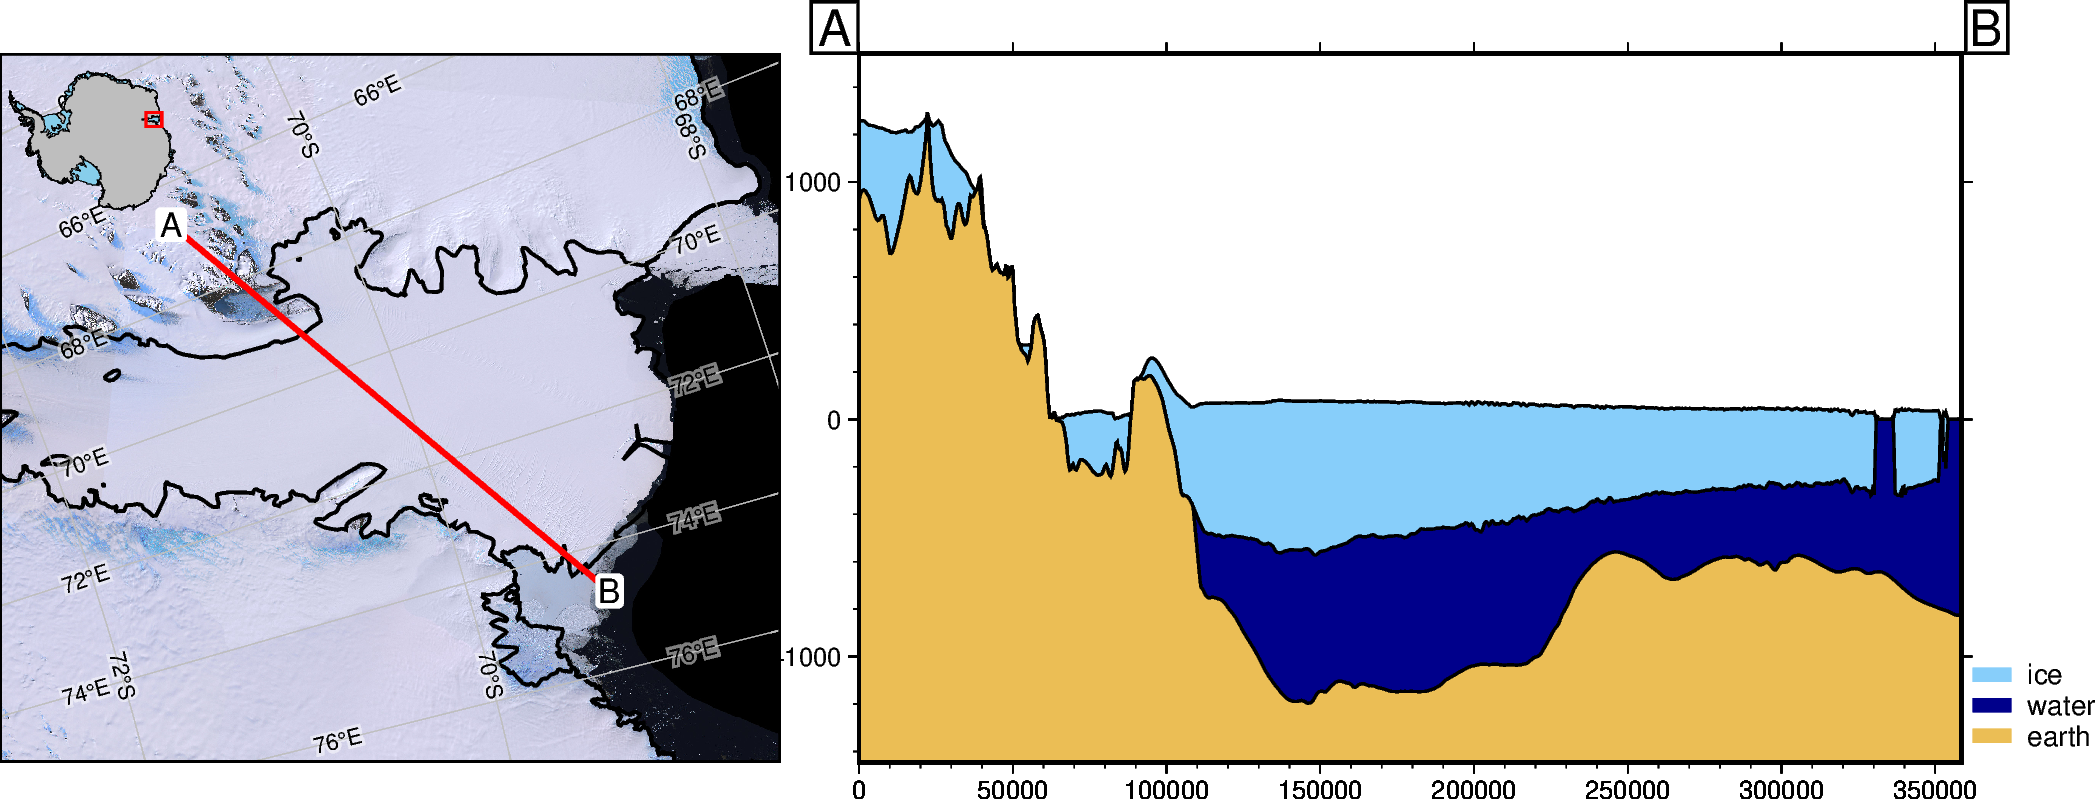
Define a profile between two points and plot a cross section of ice, ocean, and earth layers between them using the profiles module.
[5]:
# meters east and north of the south pole in EPSG 3031
a = (1925000, 830000)
b = (2200000, 600000)

fig, _, _ = profiles.plot_profile(
    method="points",
    start=a,
    stop=b,
    add_map=True,
)
fig.show(dpi=200)
gmtset [WARNING]: Representation of font type not recognized. Using default.
[ ]: