Ice Velocity#
Description: Gridded estimates of ice velocity from the MEaSUREs Phase-Based Antarctica Ice Velocity Map.
Requires an EarthData login, see link for how to configure this.
Dataset:
Mouginot, J., E. Rignot, and B. Scheuchl. “MEaSUREs Phase Map of Antarctic Ice Velocity, Version 1.” NASA National Snow and Ice Data Center Distributed Active Archive Center, 2019. https://doi.org/10.5067/PZ3NJ5RXRH10.
Associated paper:
Mouginot, J., E. Rignot, and B. Scheuchl. “Continent‐wide, Interferometric SAR Phase, Mapping of Antarctic Ice Velocity.” Geophysical Research Letters 46, no. 16 (2019): 9710–18. https://doi.org/10.1029/2019GL083826.
[1]:
%%capture
%load_ext autoreload
%autoreload 2

from polartoolkit import fetch, maps, utils
[2]:
data = fetch.ice_vel(
    hemisphere="south",
    # available options
    # region,
    # spacing,
    # registration ("g" for gridline or "p" for pixel),
)
data
[2]:
<xarray.DataArray 'z' (y: 1120, x: 1120)> Size: 5MB
[1254400 values with dtype=float32]
Coordinates:
  * y        (y) float64 9kB -2.795e+06 -2.79e+06 ... 2.795e+06 2.8e+06
  * x        (x) float64 9kB -2.8e+06 -2.795e+06 ... 2.79e+06 2.795e+06
[3]:
_ = utils.get_grid_info(data, print_info=True)
grid spacing: 5000.0 m
grid region: (-2800000.0, 2795000.0, -2795000.0, 2800000.0)
grid zmin: 2.87566308543e-05
grid zmax: 4201.68994141
grid registration: g
[4]:
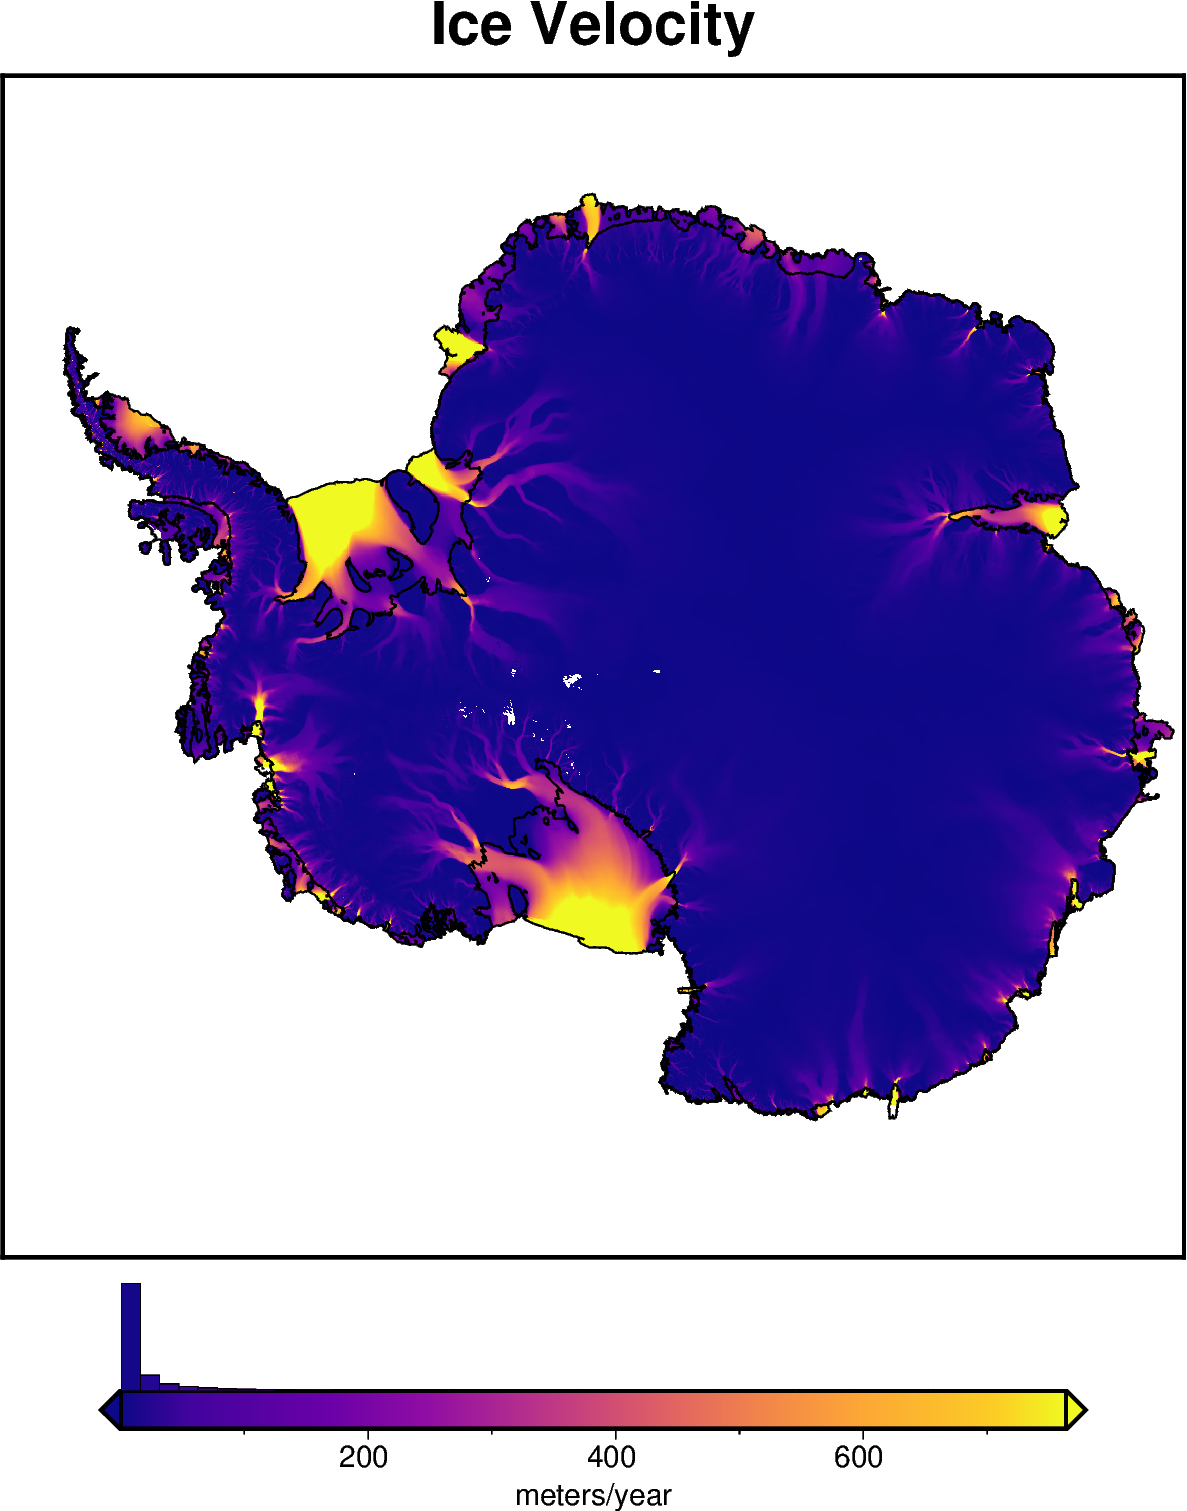
fig = maps.plot_grd(
    data,
    title="Ice Velocity",
    cmap="plasma",
    coast=True,
    cbar_label="meters/year",
    hist=True,
    robust=True,
    grd2cpt=True,
    hemisphere="south",
)

fig.show(dpi=200)
/home/mattd/polartoolkit/src/polartoolkit/maps.py:1626: UserWarning: getting max/min values from grid/points, if cpt_lims were used to create the colorscale, histogram will not properly align with colorbar!
  add_colorbar(
[ ]: