IBCSO v2 data coverage#
Description: International Bathymetric Chart of the Southern Ocean Version 2 data coverage.
Dataset:
Dorschel, Boris, Laura Hehemann, Sacha Viquerat, Fynn Warnke, Simon Dreutter, Yvonne Schulze Tenberge, Daniela Accettella, et al. “The International Bathymetric Chart of the Southern Ocean Version 2 (IBCSO V2).” PANGAEA, 2022. https://doi.org/10.1594/PANGAEA.937574.
Associated paper:
Dorschel, Boris, Laura Hehemann, Sacha Viquerat, Fynn Warnke, Simon Dreutter, Yvonne Schulze Tenberge, Daniela Accettella, et al. “The International Bathymetric Chart of the Southern Ocean Version 2.” Scientific Data 9, no. 1 (December 2022): 275. https://doi.org/10.1038/s41597-022-01366-7.
[1]:
%%capture
%load_ext autoreload
%autoreload 2


from polartoolkit import fetch, maps, regions
[2]:
points_gdf, polygons_gdf = fetch.ibcso_coverage(
    # available options
    # region
)
[3]:
points_gdf.head()
[3]:
| dataset_name | dataset_tid | weight | geometry | easting | northing | |
|---|---|---|---|---|---|---|
| 0 | GA_Obrien.xyz | 10 | 10 | POINT (1020553.092 -2525268.921) | 1.020553e+06 | -2.525269e+06 |
| 0 | GA_Obrien.xyz | 10 | 10 | POINT (1020586.770 -2423117.068) | 1.020587e+06 | -2.423117e+06 |
| 0 | GA_Obrien.xyz | 10 | 10 | POINT (1020651.064 -2423289.540) | 1.020651e+06 | -2.423290e+06 |
| 0 | GA_Obrien.xyz | 10 | 10 | POINT (1020754.140 -2423447.725) | 1.020754e+06 | -2.423448e+06 |
| 0 | GA_Obrien.xyz | 10 | 10 | POINT (1020857.215 -2423605.911) | 1.020857e+06 | -2.423606e+06 |
[4]:
polygons_gdf.head()
[4]:
| dataset_name | dataset_tid | weight | geometry | |
|---|---|---|---|---|
| 13 | RITS94B_SB.xyz | 11 | 10 | POLYGON ((-1887017.570 -1562081.910, -1889977.... |
| 13 | RITS94B_SB.xyz | 11 | 10 | POLYGON ((-2031884.502 -1522688.718, -2025725.... |
| 13 | RITS94B_SB.xyz | 11 | 10 | POLYGON ((-2046682.463 -1488500.326, -2044616.... |
| 13 | RITS94B_SB.xyz | 11 | 10 | POLYGON ((-2140062.697 -1334397.426, -2138006.... |
| 13 | RITS94B_SB.xyz | 11 | 10 | POLYGON ((-2163025.050 -885866.136, -2153297.1... |
[5]:
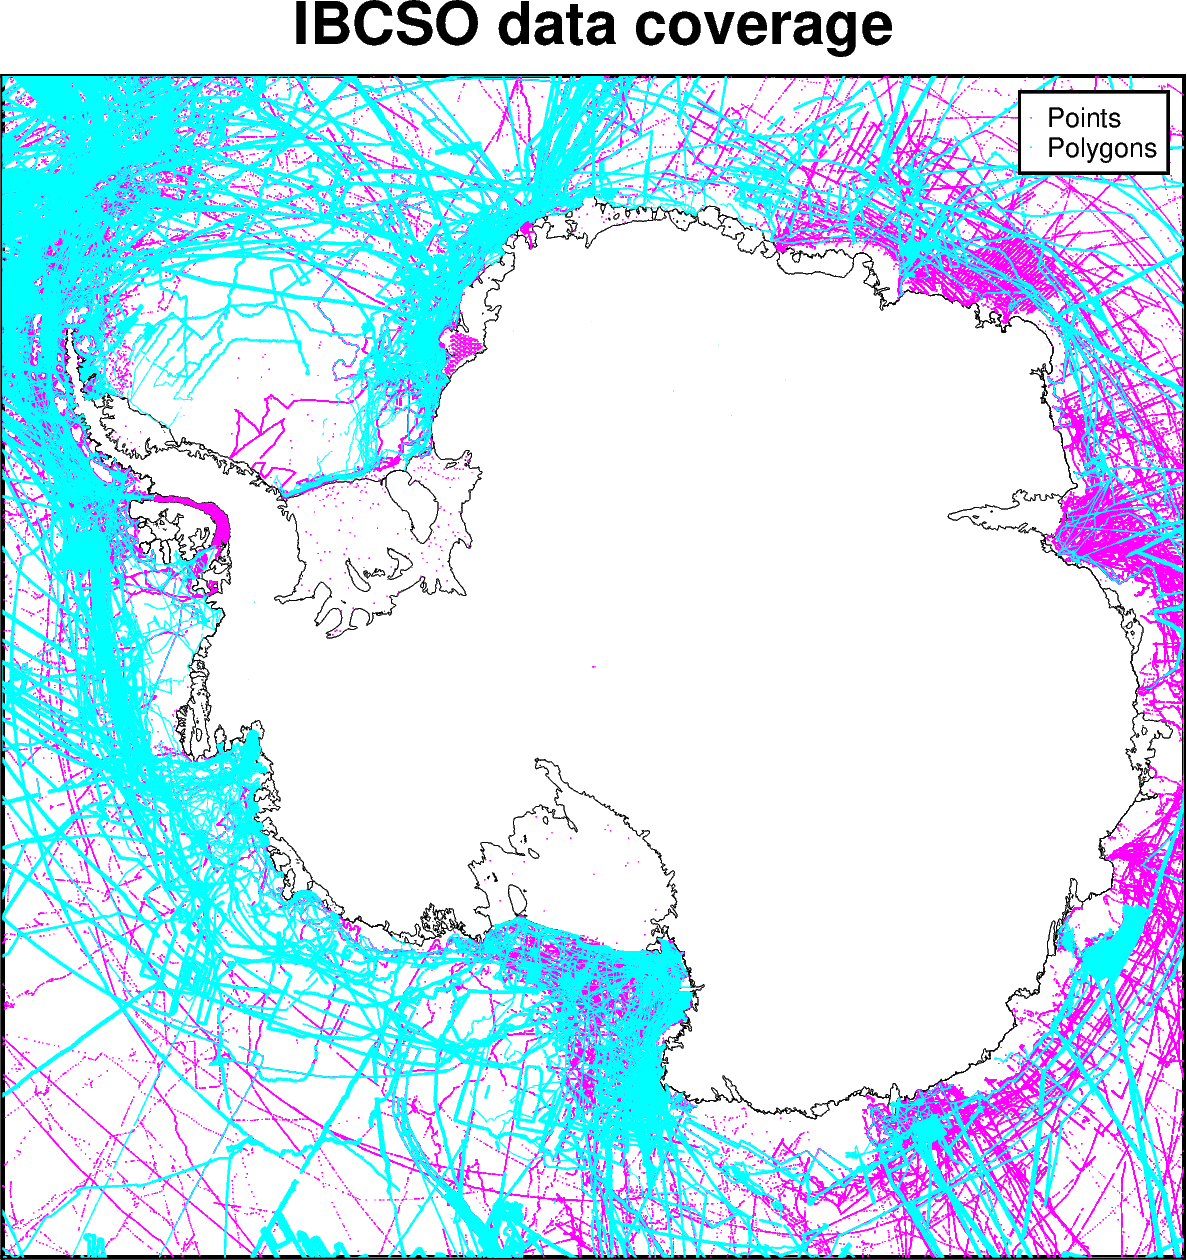
fig = maps.basemap(
    region=regions.antarctica,
    coast=True,
    coast_pen="0.1,black",
    title="IBCSO data coverage",
    hemisphere="south",
)
# plot the points
fig.plot(
    data=points_gdf[::10],  # decrease the number of points to plot
    style="p",
    fill="magenta",
    label="Points",
)

# plot the polygons
fig.plot(
    data=polygons_gdf,
    close=True,
    fill="cyan",
    label="Polygons",
)

fig.legend()

fig.show(dpi=200)
[ ]: