Ice Velocity#
Description: Gridded estimates of ice velocity from the MEaSUREs Phase-Based Greenland Ice Velocity Map.
Requires an EarthData login, see link for how to configure this.
Dataset:
National Snow and Ice Data Center. “MEaSUREs Multi-Year Greenland Ice Sheet Velocity Mosaic, Version 1,” October 21, 2020. https://nsidc.org/data/nsidc-0670/versions/1.
Associated paper:
N.A.
[1]:
%%capture
%load_ext autoreload
%autoreload 2

from polartoolkit import fetch, maps, utils
[2]:
data = fetch.ice_vel(
    hemisphere="north",
    # available options
    # region,
    # spacing,
    # registration ("g" for gridline or "p" for pixel),
)
data
[2]:
<xarray.DataArray (y: 10920, x: 6020)> Size: 263MB
array([[nan, nan, nan, ..., nan, nan, nan],
       [nan, nan, nan, ..., nan, nan, nan],
       [nan, nan, nan, ..., nan, nan, nan],
       ...,
       [nan, nan, nan, ..., nan, nan, nan],
       [nan, nan, nan, ..., nan, nan, nan],
       [nan, nan, nan, ..., nan, nan, nan]], dtype=float32)
Coordinates:
  * x        (x) float64 48kB -6.45e+05 -6.448e+05 ... 8.595e+05 8.598e+05
* y (y) float64 87kB -6.402e+05 -6.405e+05 ... -3.37e+06 -3.37e+06[3]:
_ = utils.get_grid_info(data, print_info=True)
grid spacing: 250.0 m
grid region: (-645000.0, 859750.0, -3370000.0, -640250.0)
grid zmin: 0.00136277475394
grid zmax: 12906.4941406
grid registration: g
[4]:
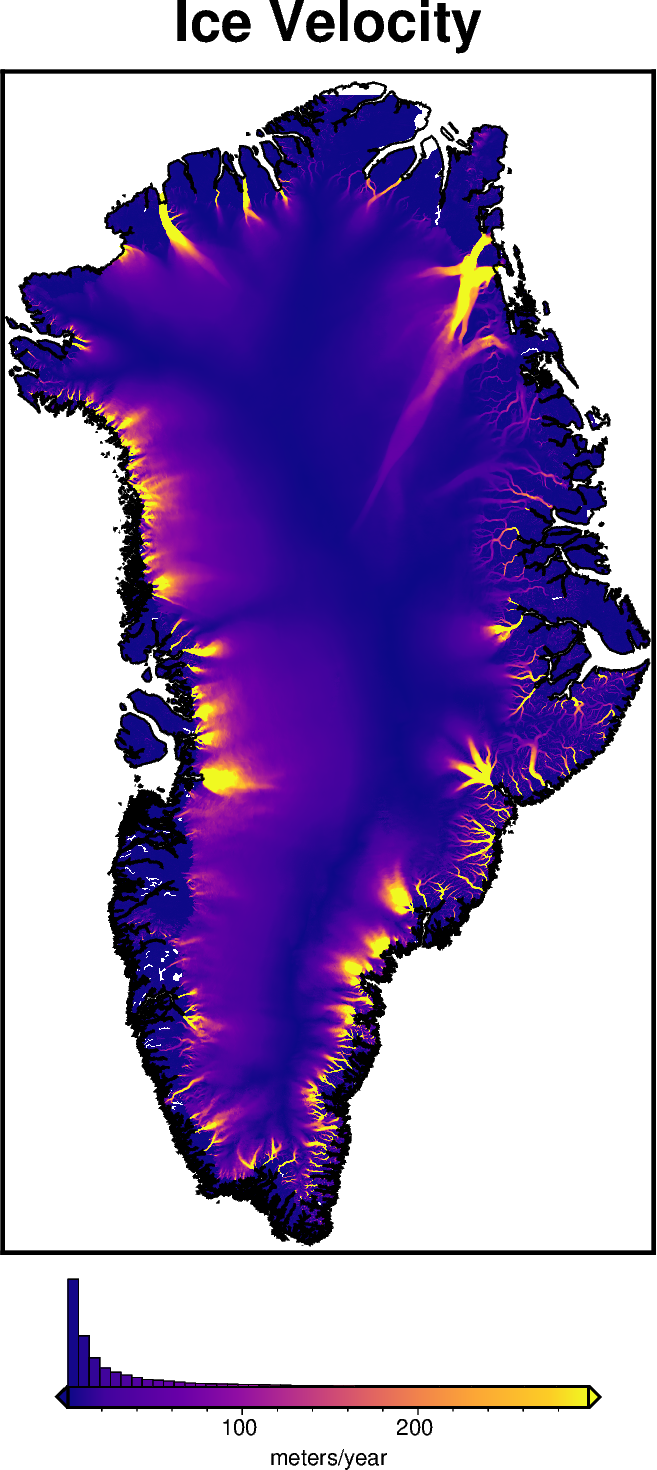
fig = maps.plot_grd(
    data,
    title="Ice Velocity",
    cmap="plasma",
    coast=True,
    cbar_label="meters/year",
    hist=True,
    robust=True,
    grd2cpt=True,
    hemisphere="north",
)

fig.show(dpi=200)
/home/mattd/polartoolkit/src/polartoolkit/maps.py:1626: UserWarning: getting max/min values from grid/points, if cpt_lims were used to create the colorscale, histogram will not properly align with colorbar!
  add_colorbar(
[ ]: