Gravity#
Description: Gridded gravity anomaly data from various sources.
Datasets:
ANTGG (2016) accessed from https://doi.pangaea.de/10.1594/PANGAEA.848168
ANTGG-2021 accessed from https://doi.pangaea.de/10.1594/PANGAEA.971238?format=html#download
Uieda, Leonardo. “Fatiando a Terra Data: Earth - Gravity Grid at 10 Arc-Minute Resolution.” Zenodo, January 20, 2022. https://doi.org/10.5281/zenodo.5882207.
Förste, Christoph, Sean.L. Bruinsma, Oleg Abrikosov, Jean-Michel Lemoine, Jean Charles Marty, Frank Flechtner, G. Balmino, F. Barthelmes, and R. Biancale. “EIGEN-6C4 The Latest Combined Global Gravity Field Model Including GOCE Data up to Degree and Order 2190 of GFZ Potsdam and GRGS Toulouse.” Application/octet-stream,application/octet-stream,application/zip. GFZ Data Services, 2014. https://doi.org/10.5880/ICGEM.2015.1.
Associated papers:
Scheinert, M., F. Ferraccioli, J. Schwabe, R. Bell, M. Studinger, D. Damaske, W. Jokat, et al. “New Antarctic Gravity Anomaly Grid for Enhanced Geodetic and Geophysical Studies in Antarctica.” Geophysical Research Letters 43, no. 2 (2016): 600–610. https://doi.org/10.1002/2015GL067439.
[1]:
%%capture
%load_ext autoreload
%autoreload 2

import os

from polartoolkit import fetch, maps

os.environ["POLARTOOLKIT_HEMISPHERE"] = "south"
[2]:
data = fetch.gravity(version="antgg")
antgg_grids = [
    data.free_air_anomaly,
    data.bouguer_anomaly,
    data.error,
]
[3]:
antgg_2021_grids = []

antgg_2021_grids.append(
    fetch.gravity(
        version="antgg-2021",
        anomaly_type="FA",
    ).free_air_anomaly
)
antgg_2021_grids.append(
    fetch.gravity(
        version="antgg-2021",
        anomaly_type="DG",
    ).gravity_disturbance
)
antgg_2021_grids.append(
    fetch.gravity(
        version="antgg-2021",
        anomaly_type="BA",
    ).bouguer_anomaly
)
antgg_2021_grids.append(
    fetch.gravity(
        version="antgg-2021",
        anomaly_type="Err",
    ).error
)
[4]:
eigen = fetch.gravity(version="eigen").gravity
eigen
[4]:
<xarray.DataArray 'gravity' (y: 1401, x: 1401)> Size: 16MB
array([[977674.8125, 977677.5625, 977680.375 , ..., 977677.4375,
        977674.75  , 977672.0625],
       [977676.625 , 977679.375 , 977682.25  , ..., 977680.    ,
        977677.3125, 977674.625 ],
       [977678.4375, 977681.1875, 977684.    , ..., 977682.5625,
        977679.875 , 977677.125 ],
       ...,
       [977671.6875, 977674.0625, 977676.5   , ..., 977732.6875,
        977731.875 , 977731.    ],
       [977669.625 , 977672.    , 977674.375 , ..., 977730.4375,
        977729.625 , 977728.8125],
       [977667.5625, 977669.9375, 977672.25  , ..., 977728.    ,
        977727.1875, 977726.375 ]])
Coordinates:
  * x        (x) float64 11kB -3.5e+06 -3.495e+06 ... 3.495e+06 3.5e+06
  * y        (y) float64 11kB -3.5e+06 -3.495e+06 ... 3.495e+06 3.5e+06
Attributes:
    Conventions:   CF-1.7
    actual_range:  [977667.5625, 980167.75]
    description:
    history:       gmt grdsample @GMTAPI@-S-I-G-M-G-N-000000 -G@GMTAPI@-S-O-G...
    long_name:     z
title: [5]:
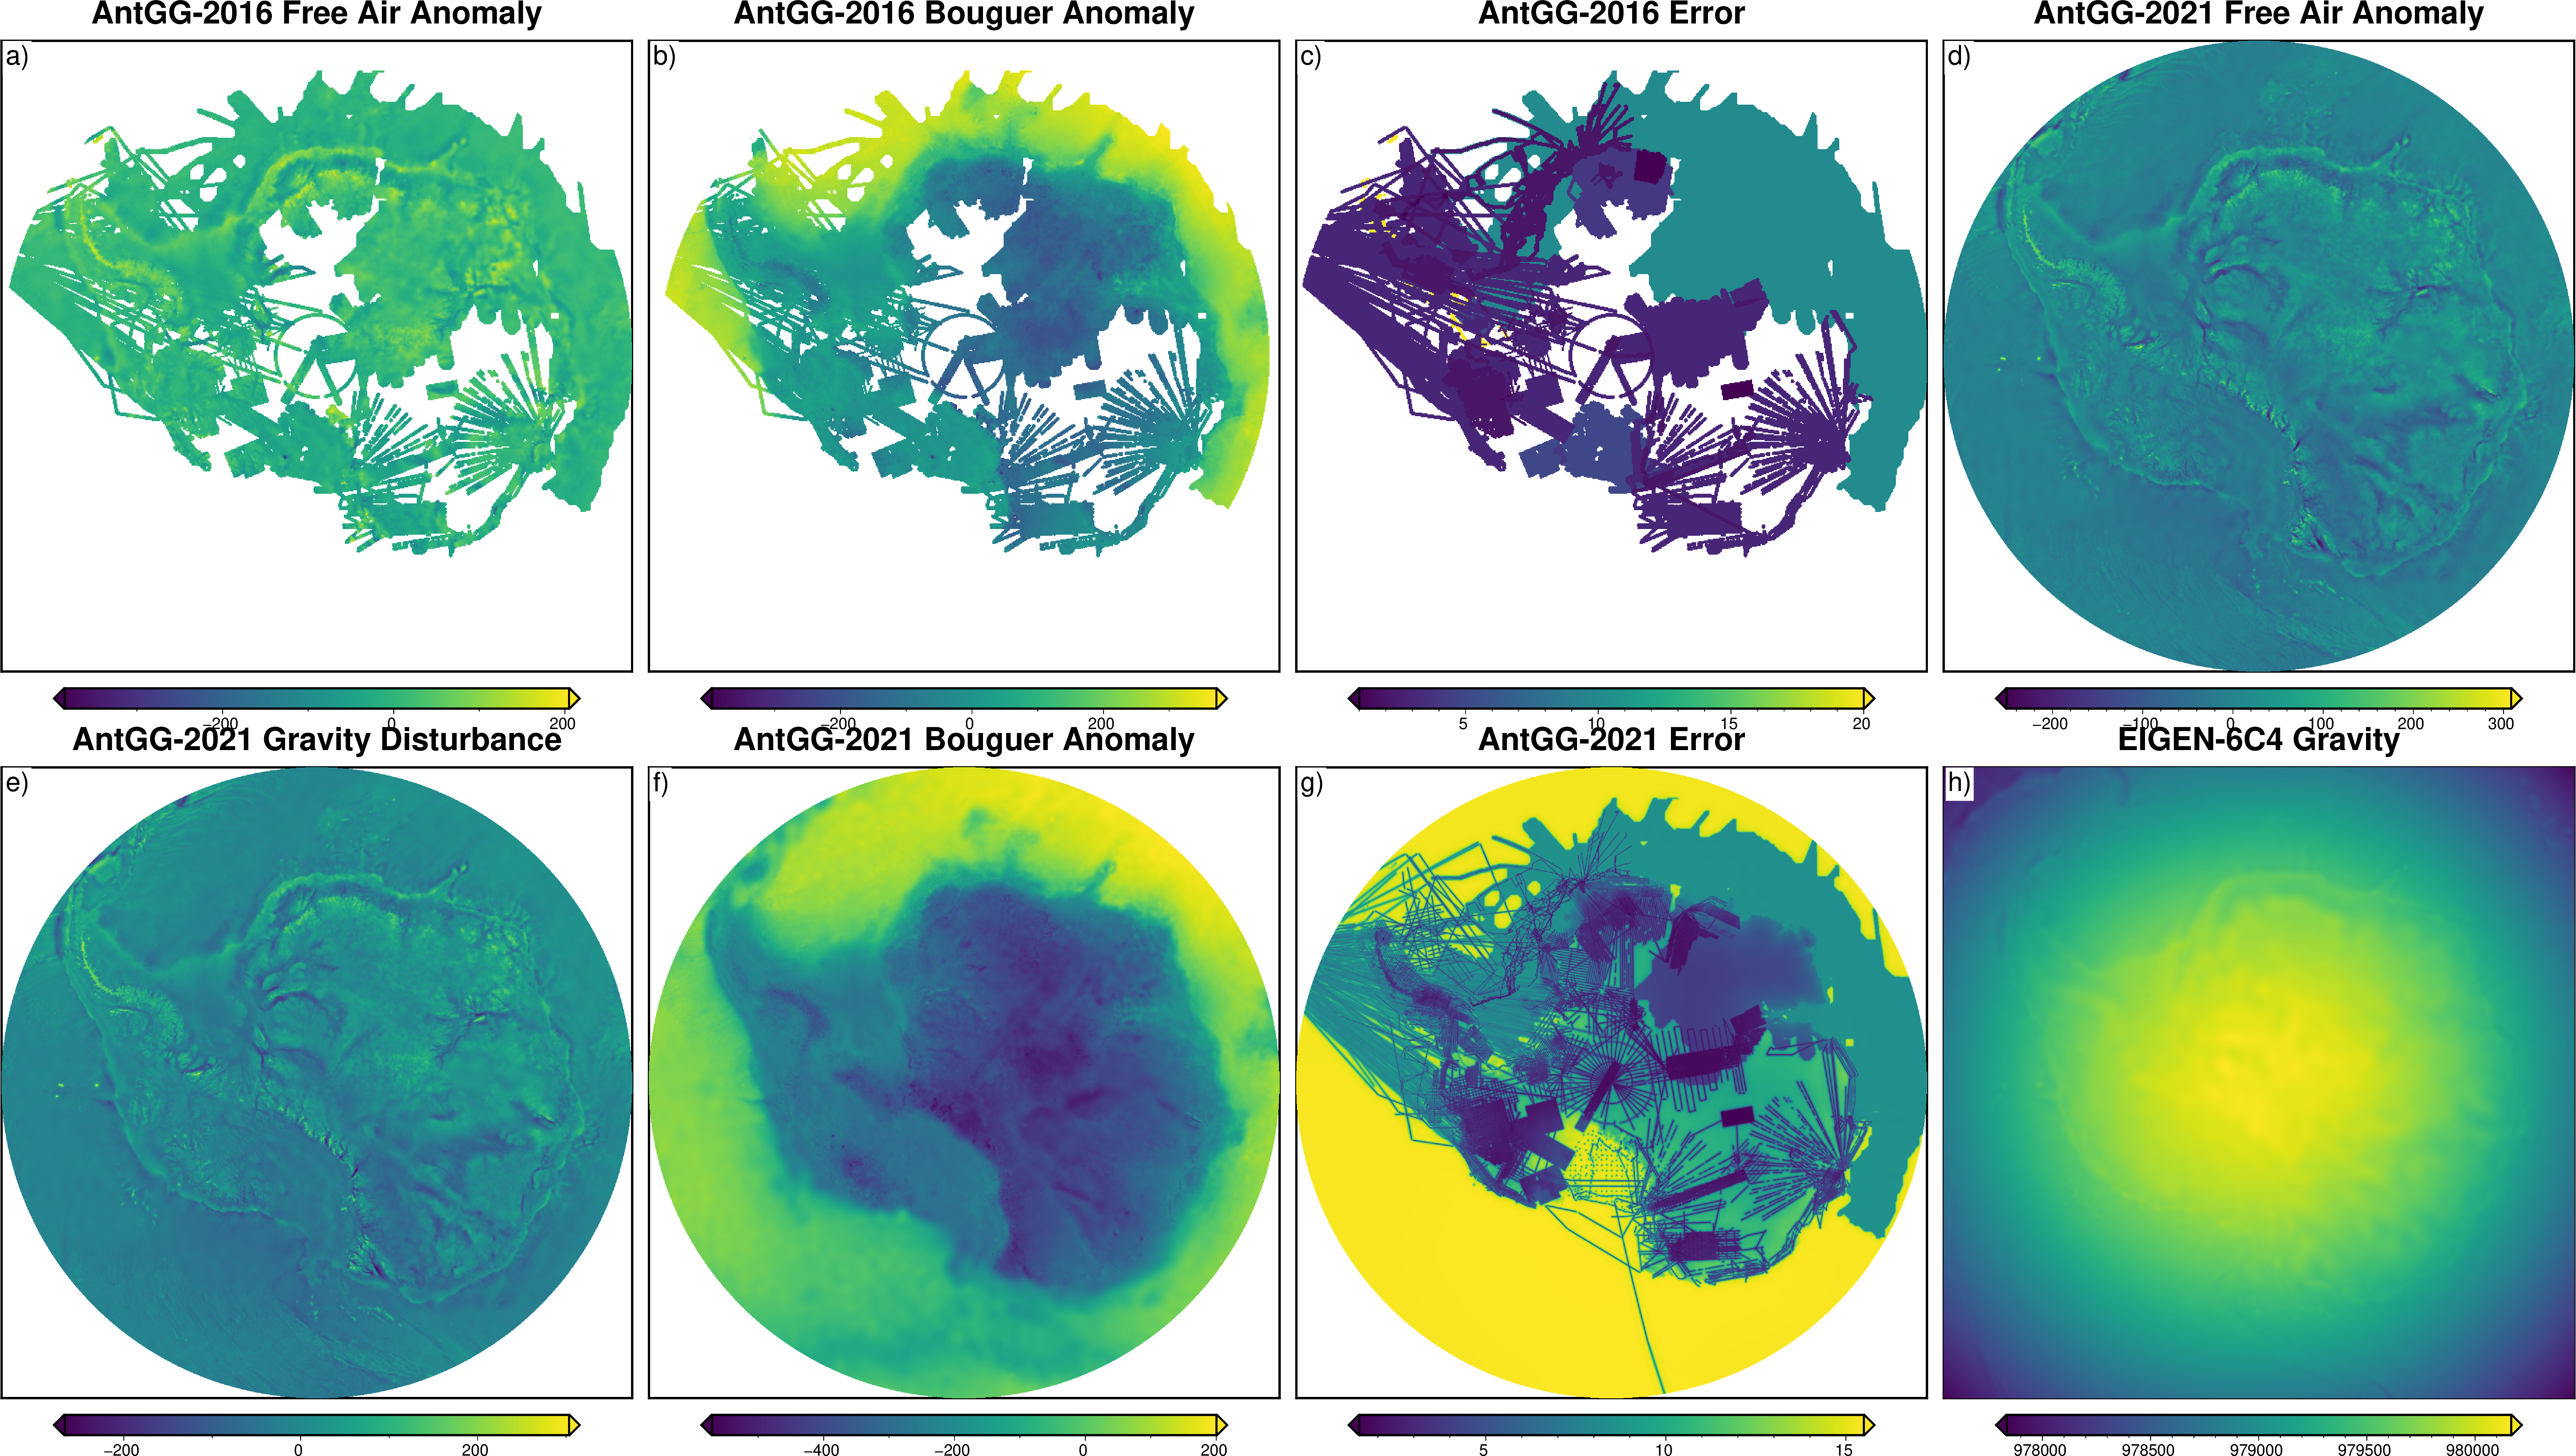
grids = antgg_grids + antgg_2021_grids + [eigen]
titles = [
    "AntGG-2016 Free Air Anomaly",
    "AntGG-2016 Bouguer Anomaly",
    "AntGG-2016 Error",
    "AntGG-2021 Free Air Anomaly",
    "AntGG-2021 Gravity Disturbance",
    "AntGG-2021 Bouguer Anomaly",
    "AntGG-2021 Error",
    "EIGEN-6C4 Gravity",
]
fig = maps.subplots(
    grids,
    titles=titles,
)

fig.show()
[ ]: